Real-Time Dashboard Guide
# Real-Time Dashboard Guide
——Learn about the reception pressure and positioning problems of the day, and adjust the reception resources and settings.
# Real-Time Dashboard Of Real-Time Reception Mode
# ● Today's Monitor
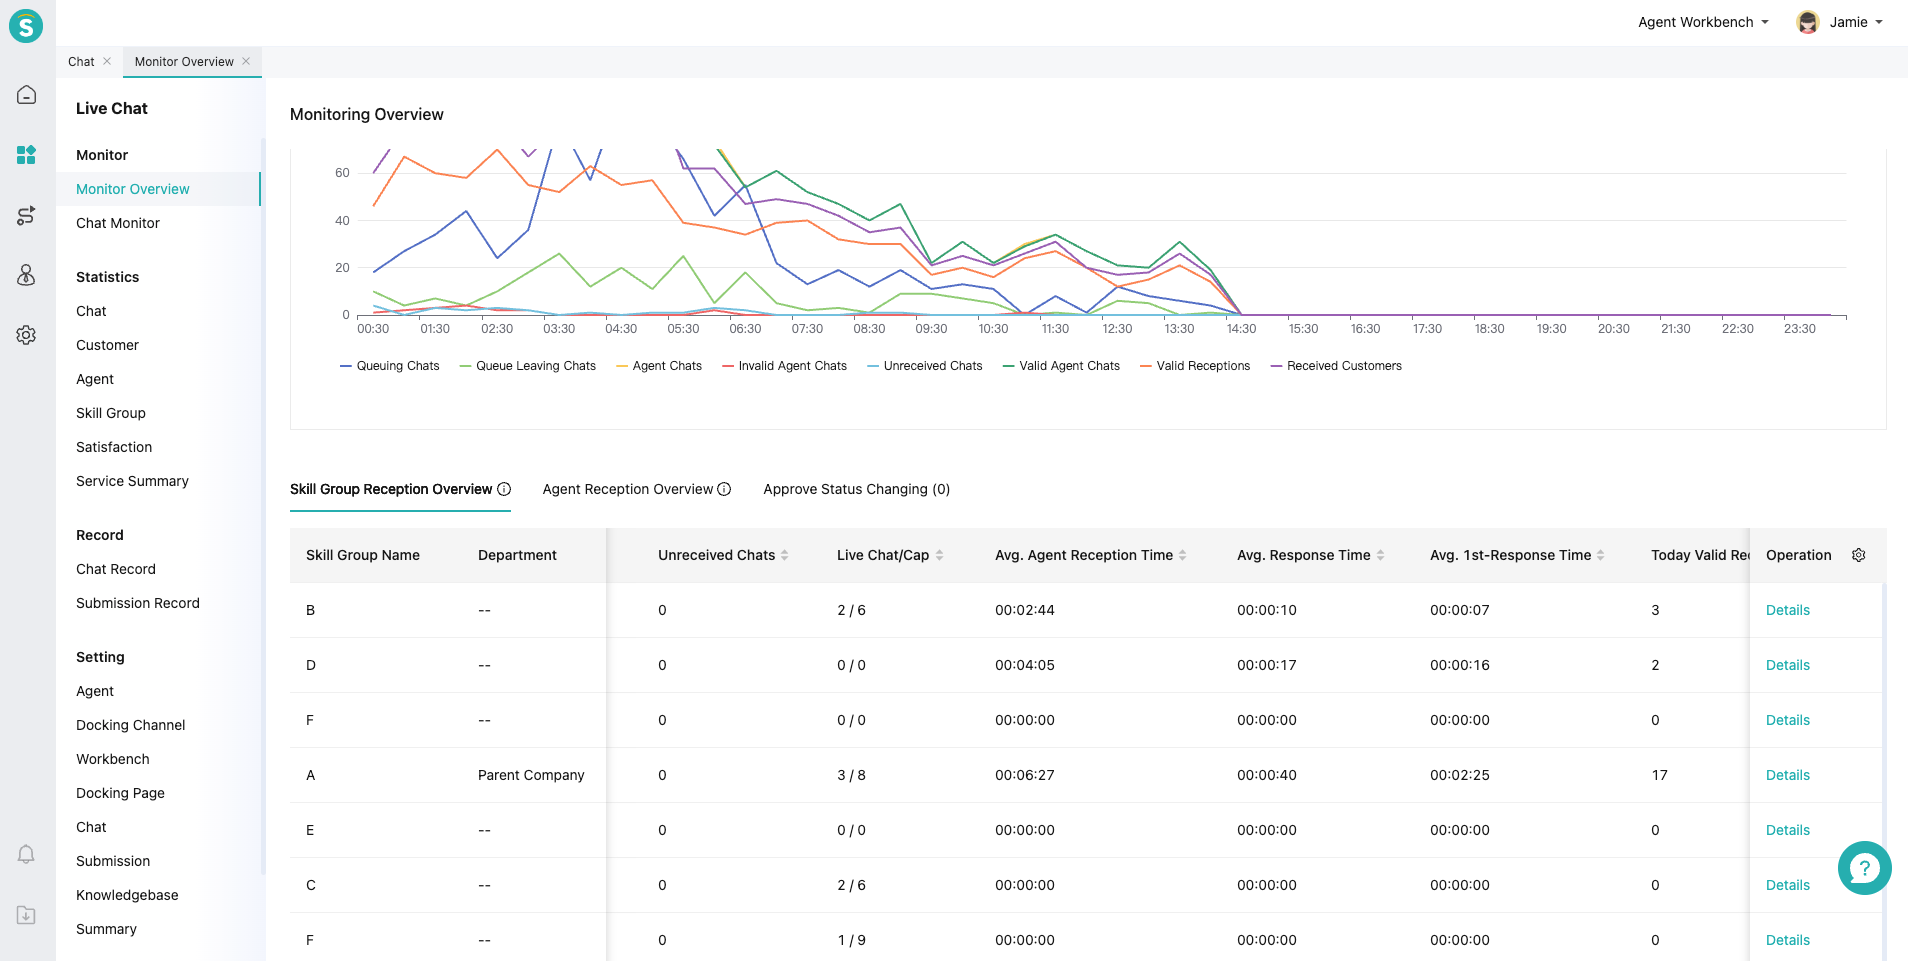
Real-Time dashboard metrics are displayed along the chat flow, showing session transitions and agent performance at each stage. It helps admin understand the reception pressure and coordinate agent resources in real time.
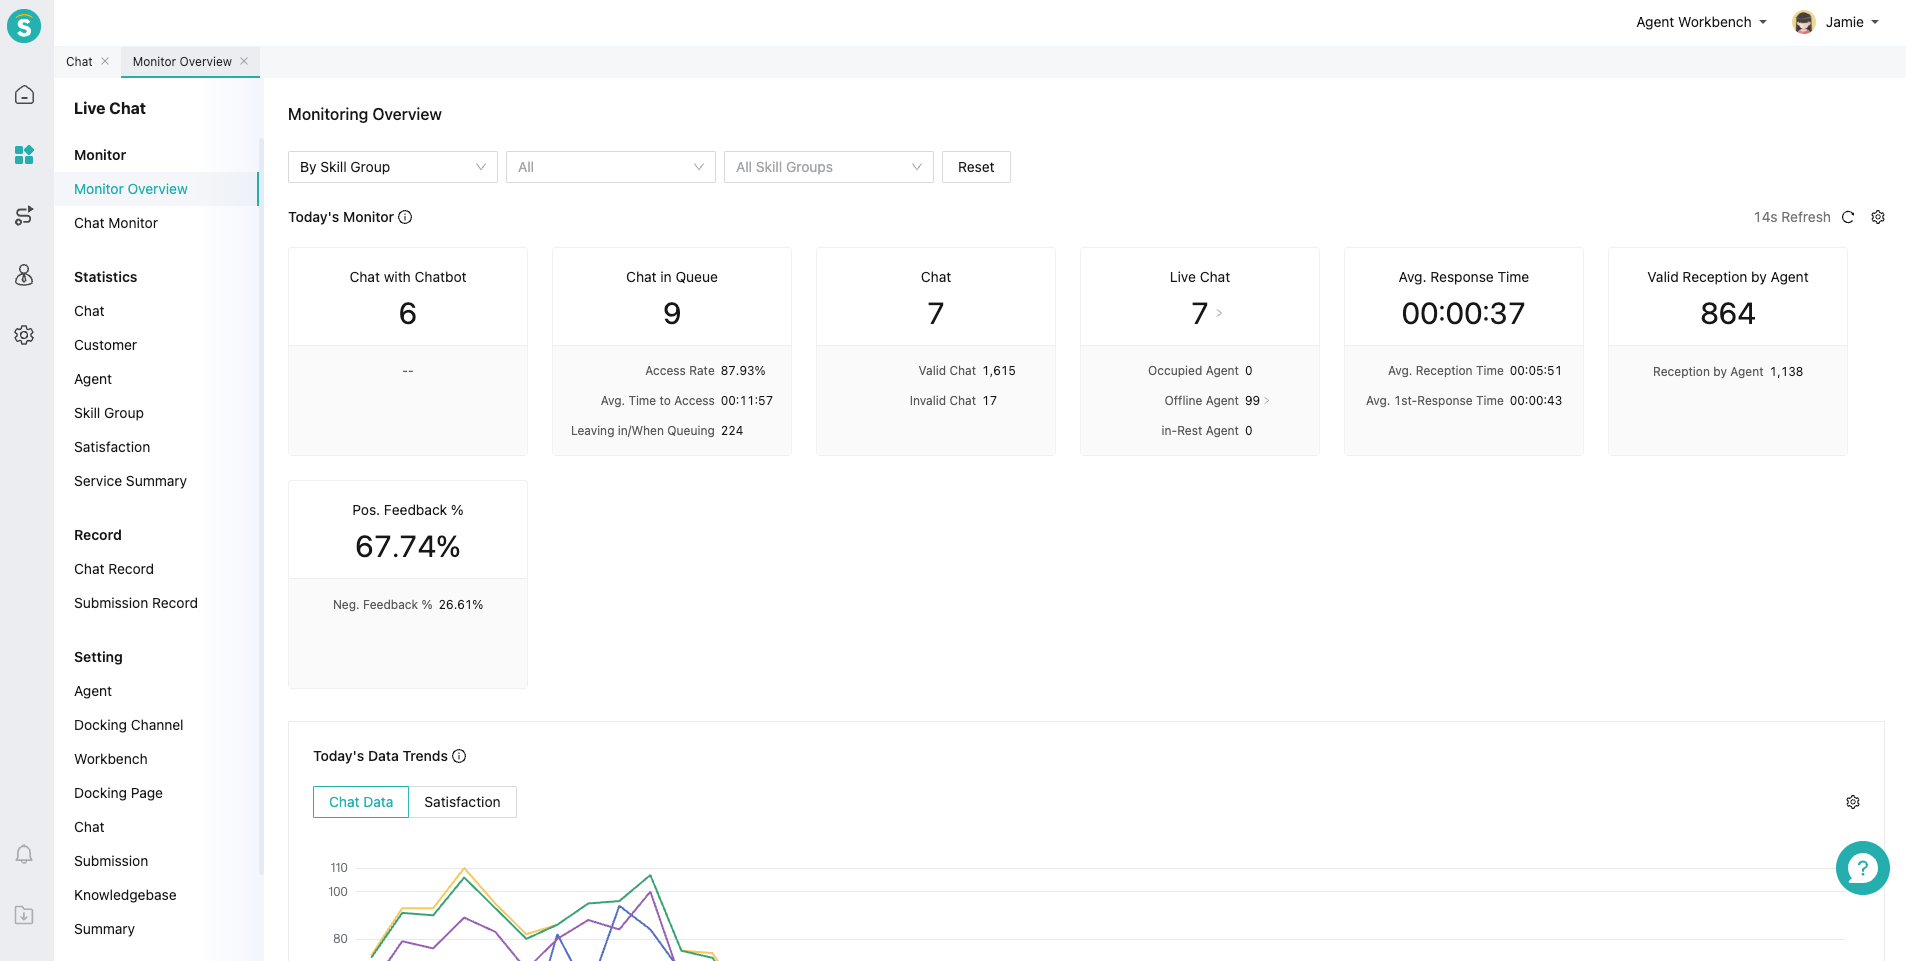
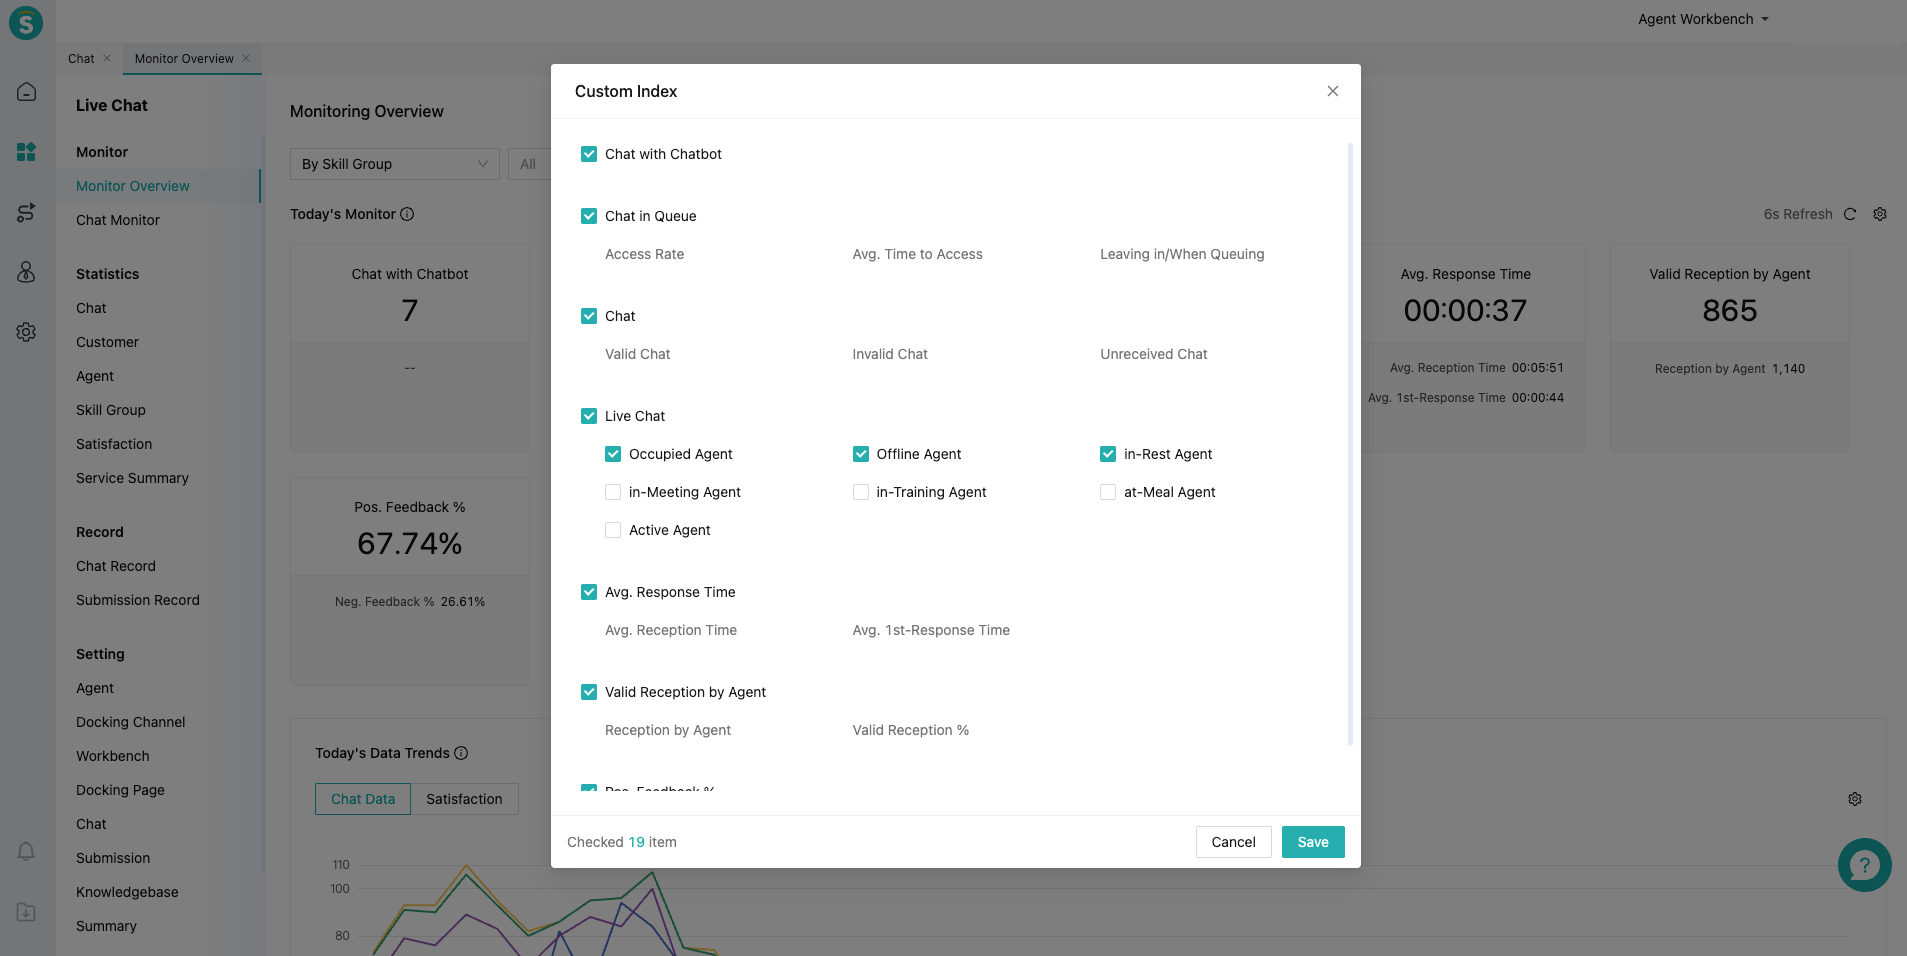
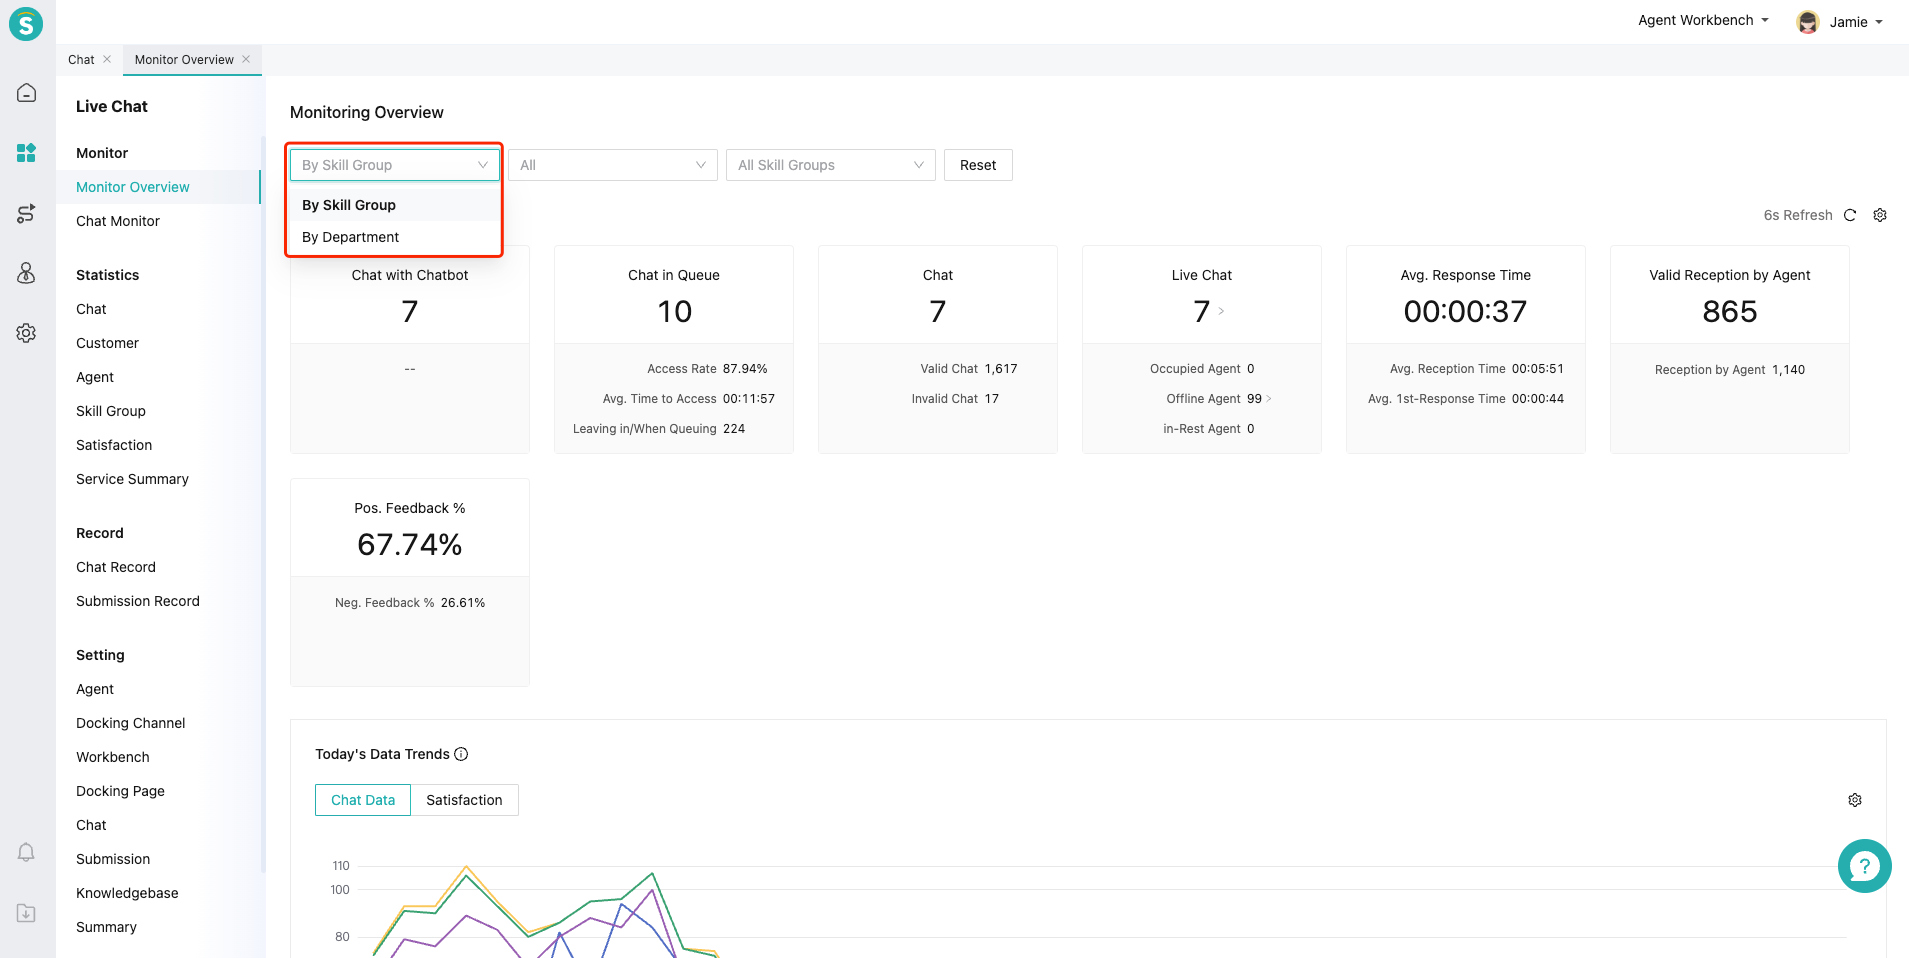
Admin can display important indicators according to business needs, and filter the monitoring range by skill group or department according to their permissions.
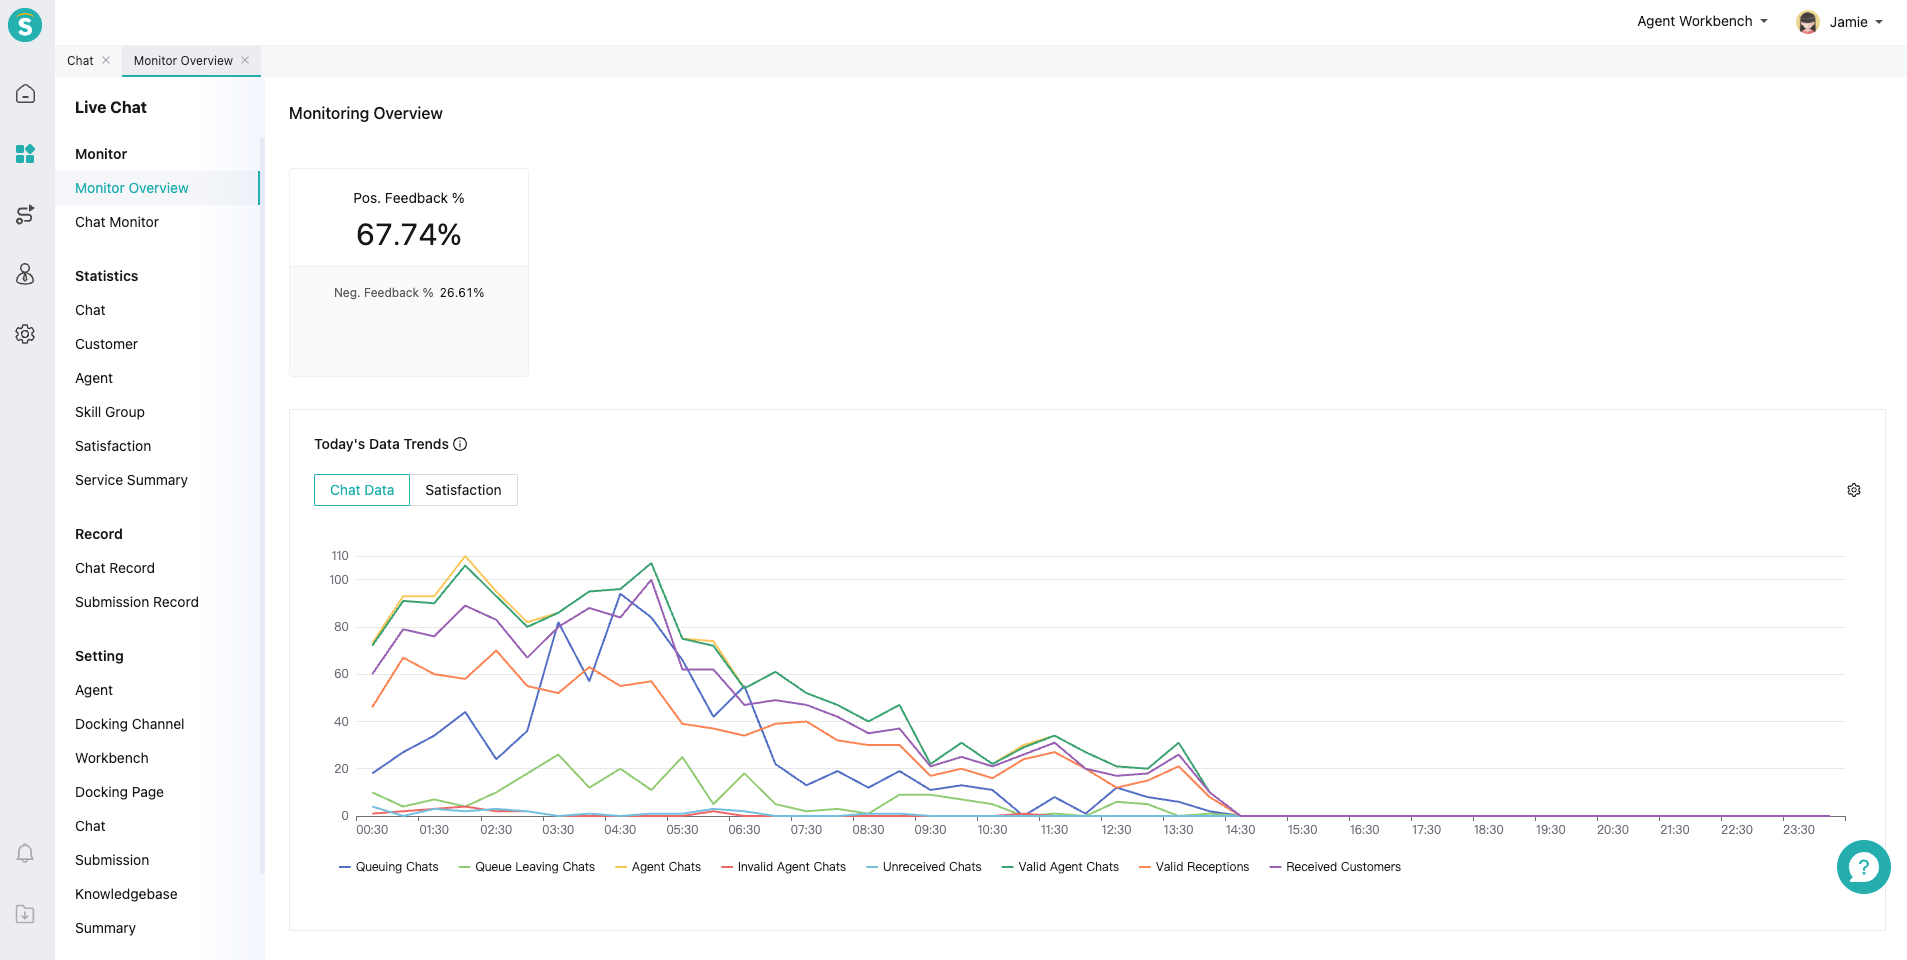
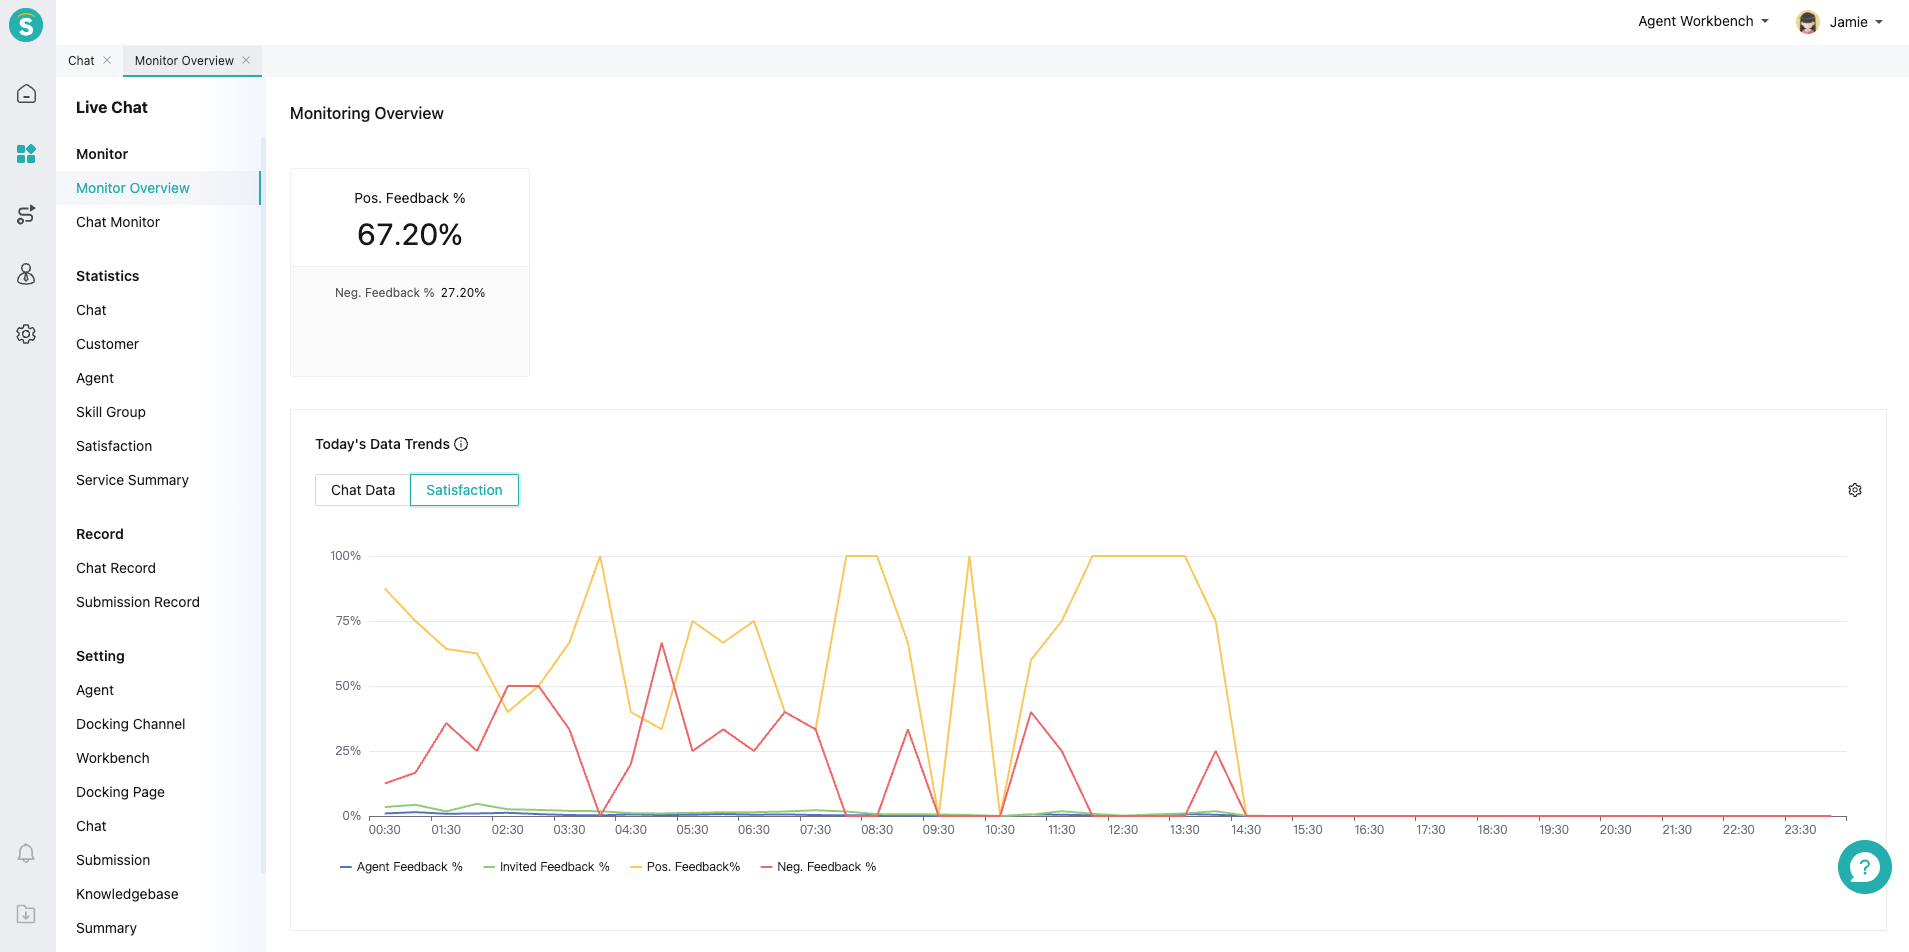
# ● Today's Data Trends
Chat data and satisfaction ratings update every half hour, helping administrators understand data trends related to reception pressure and customer service conditions.
# ● Today's Reception Overview
Today Monitor shows the overall data of the company. When the admin finds that a certain indicator is lower than expected, he/she can locate the problem through Today Reception Overview. Today Reception Overview can compare the detailed data of multiple skill groups or departments, and drill down to the agent list of skill groups or departments through「Details」.
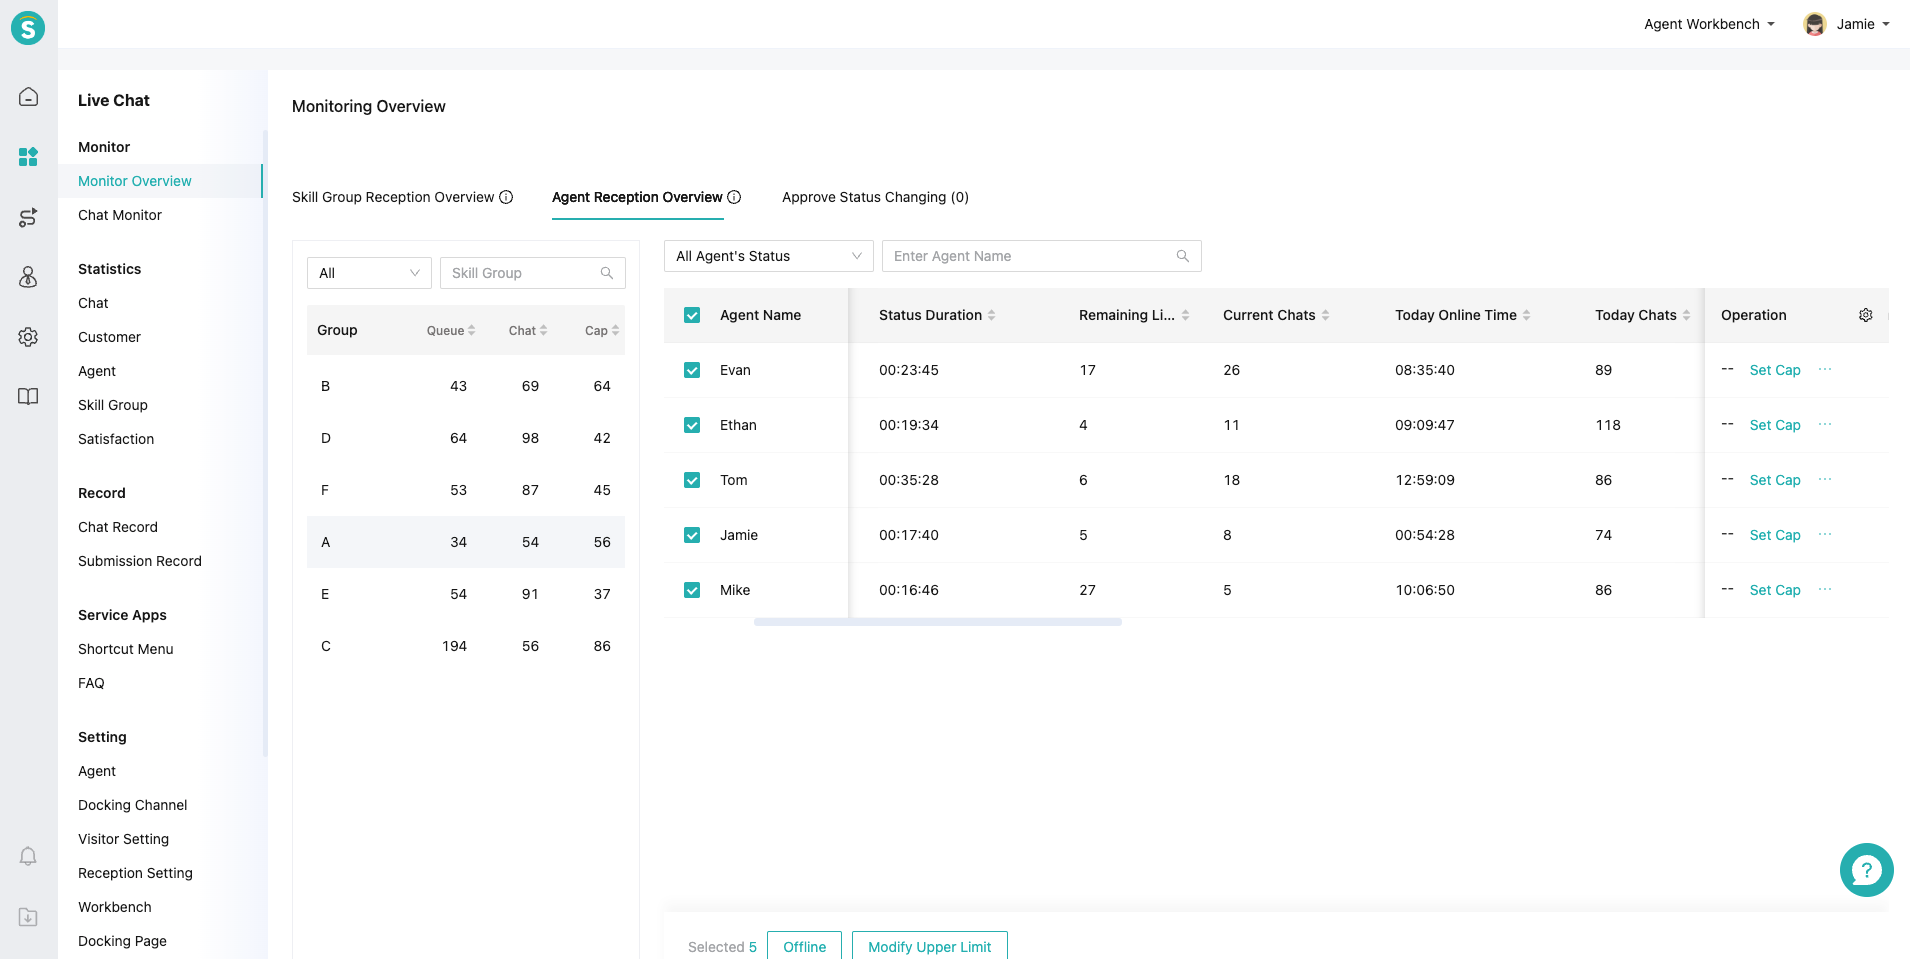
The agent list shows the detailed data of each agent, and it can be viewed by switching through the skill group or department list on the left. Admin can quickly find agent by sorting by indicators, filtering by status or searching.
When the reception pressure is high and customers queue up, the admin can quickly modify the reception limit of agent through「Set Cap」to improve the reception ability of agent. If an agent forgets to exit the workbench after the shift change, the admin can also force the agent to exit the workbench through「Offline」.
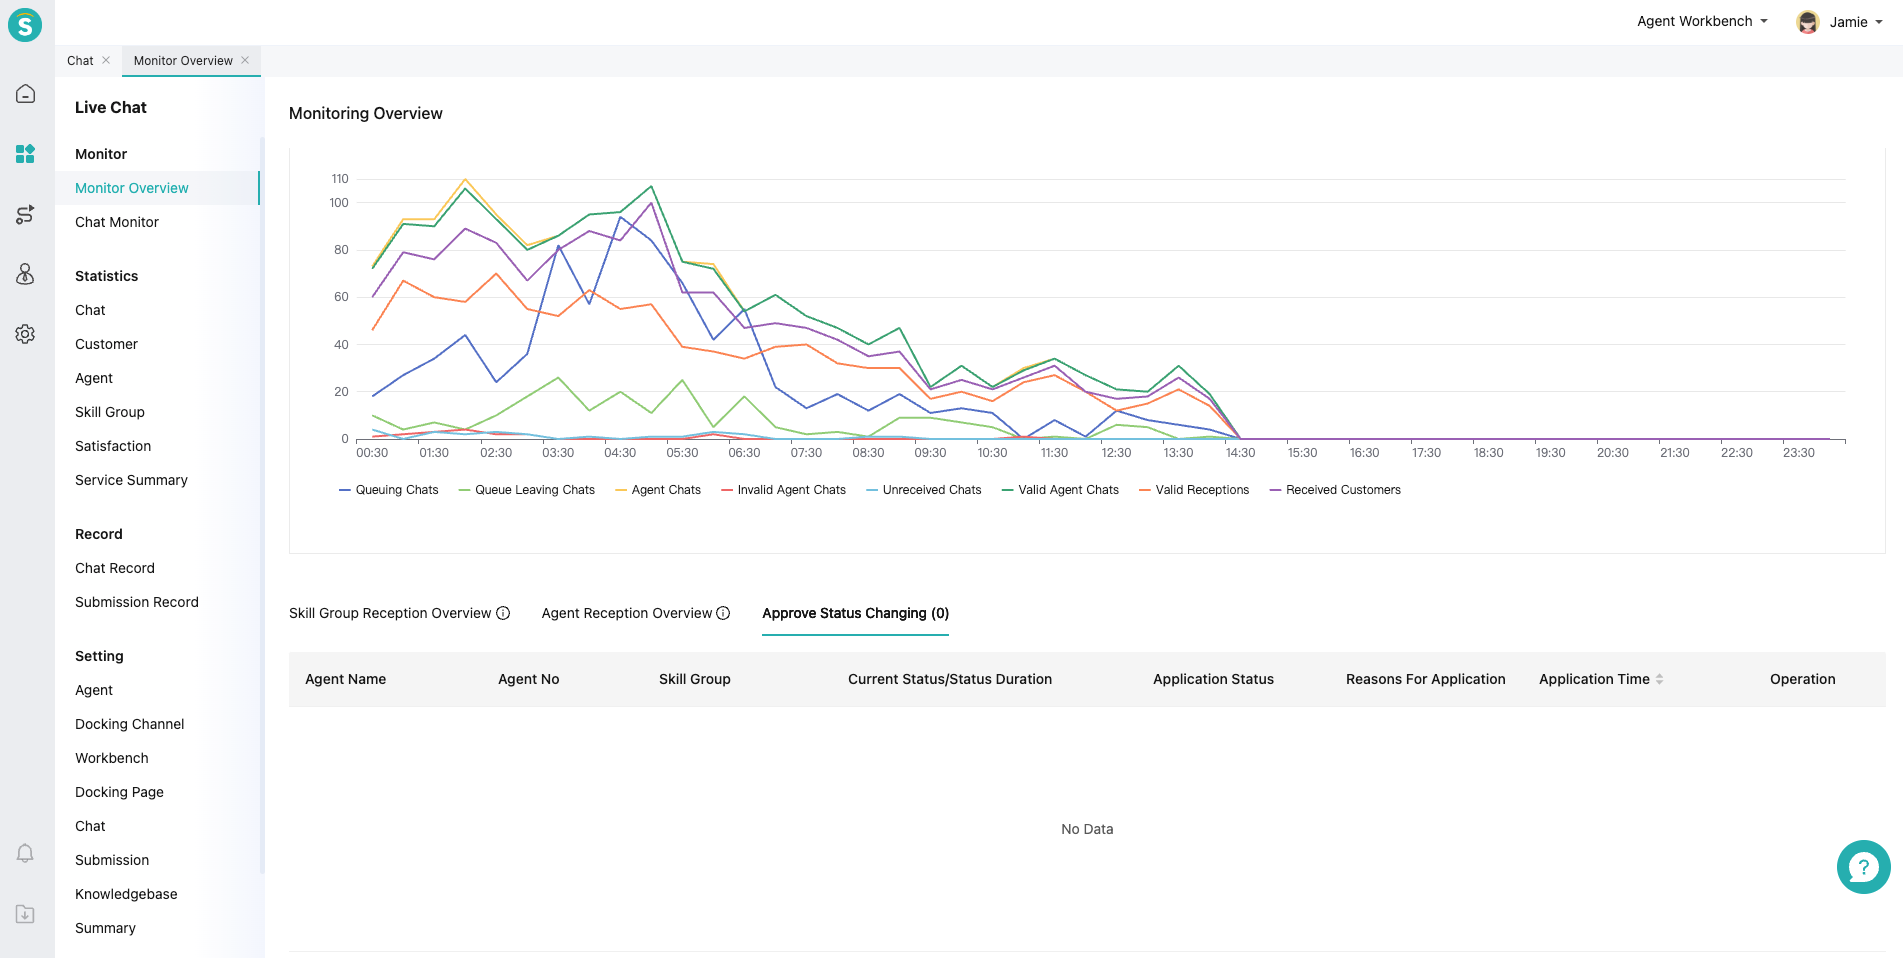
# ● Agent Status Approval
When the Agent Status Switch Approval is enabled, the agent status can be switched only after the admin approves the application.
# Real-Time Dashboard Of Always On Mode
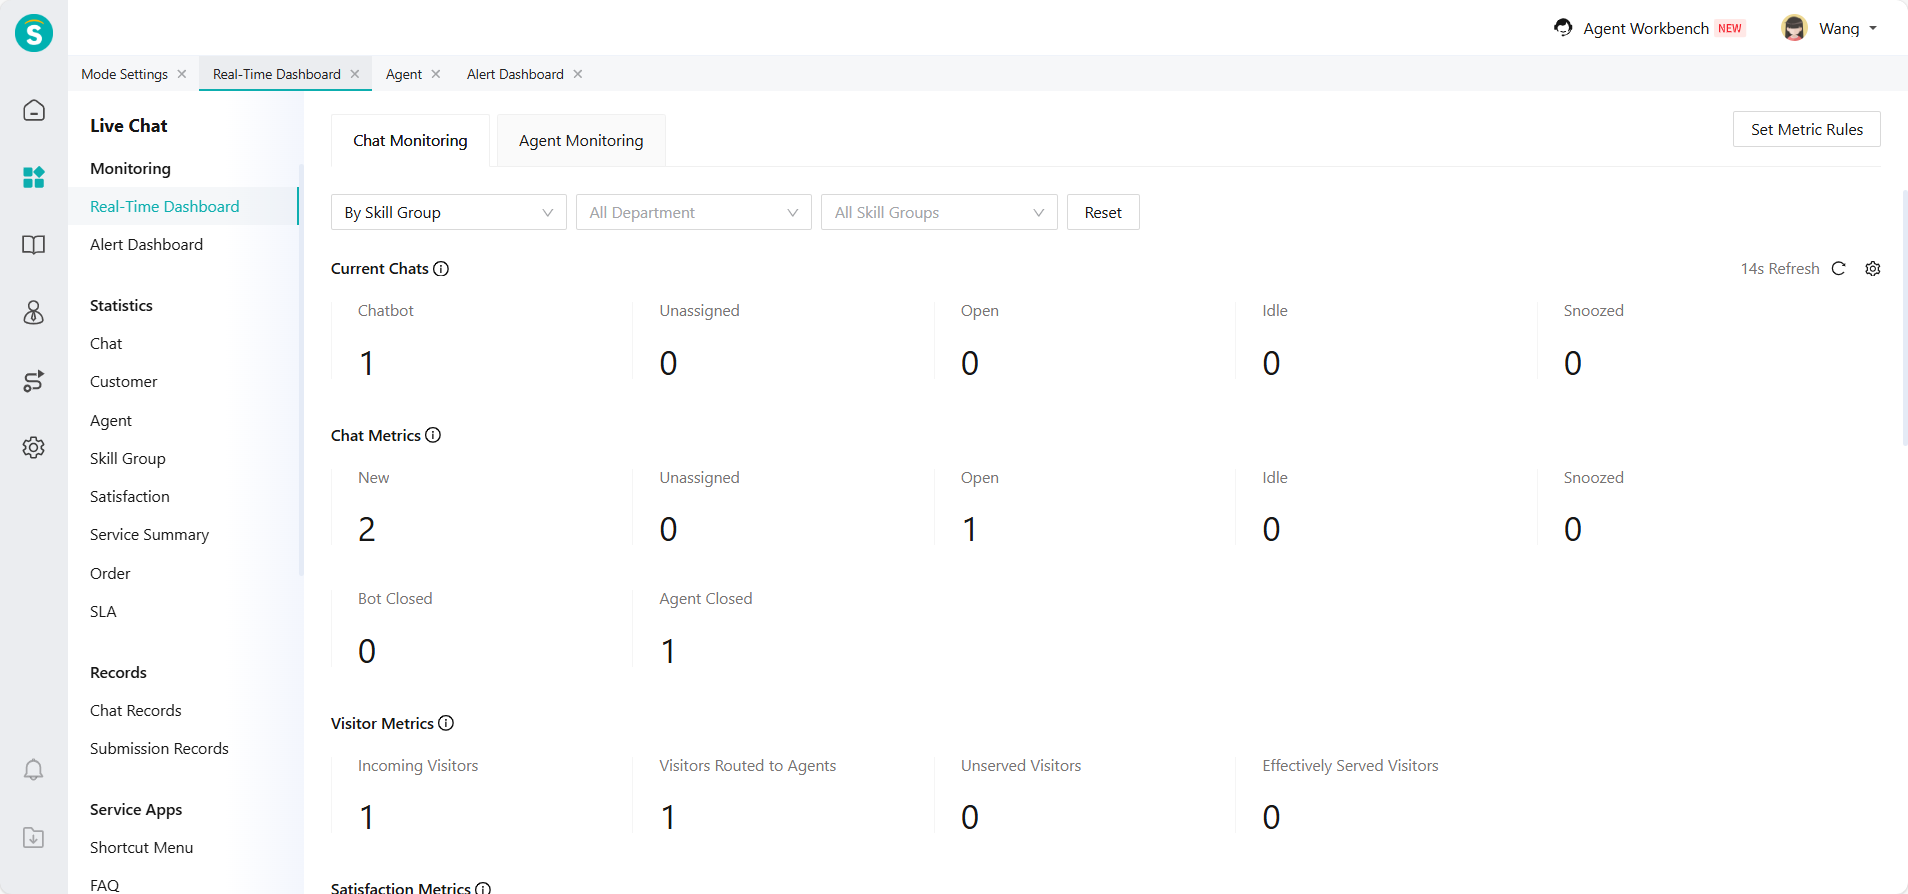
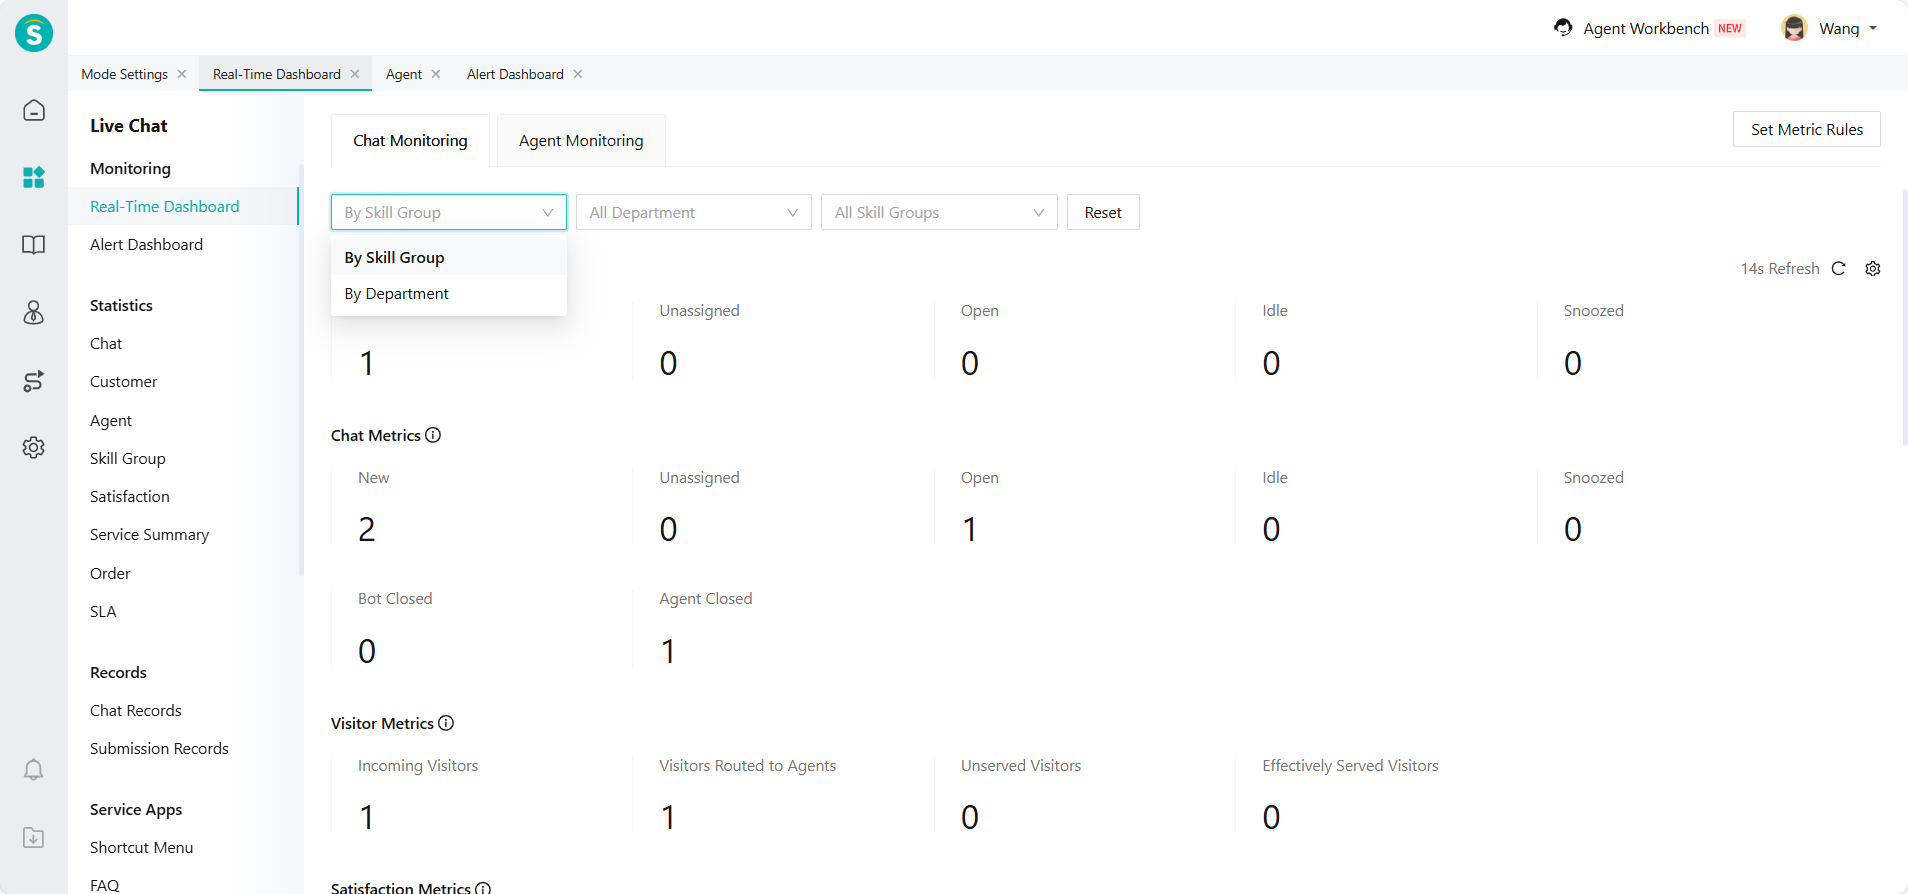
# ● Chat Monitoring
Real-Time dashboard metrics are displayed along the chat flow, providing detailed visibility into session transitions and agent performance at each stage — including current chats, chat metrics, visitor metrics, and satisfaction metrics. It helps admin understand the reception pressure and coordinate agent resources in real time.
The trend charts cover chat data and satisfaction, helping managers track the data trends of session volume and customer service performance over time.
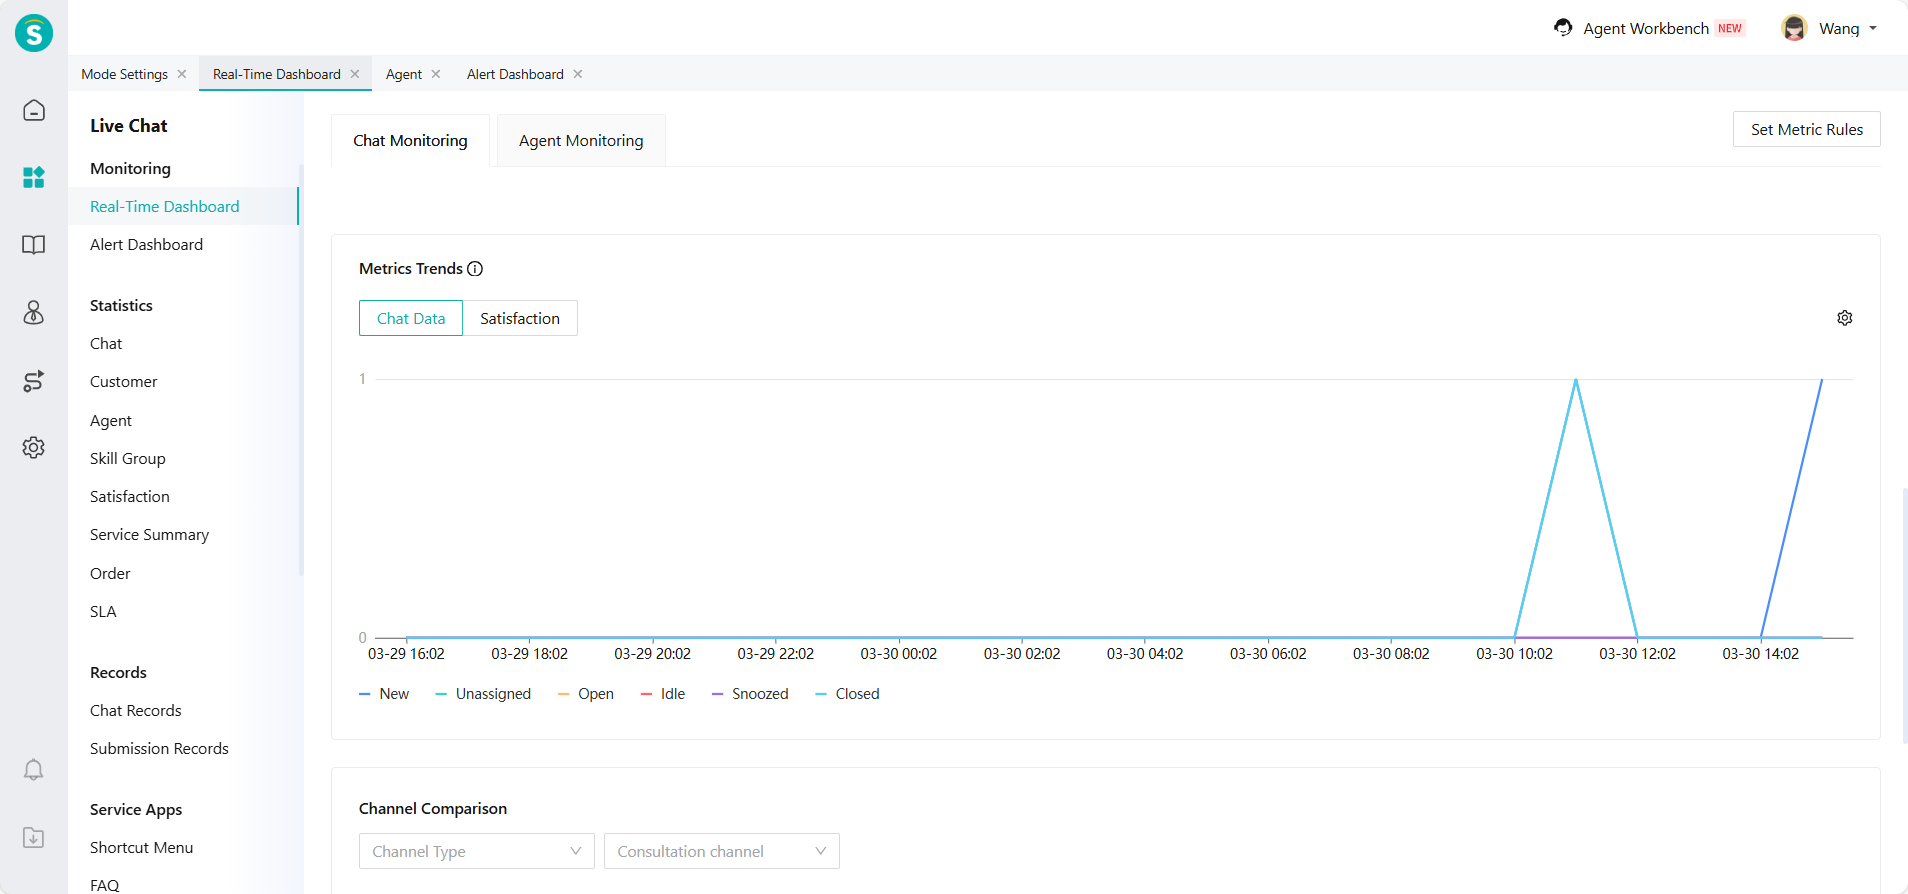
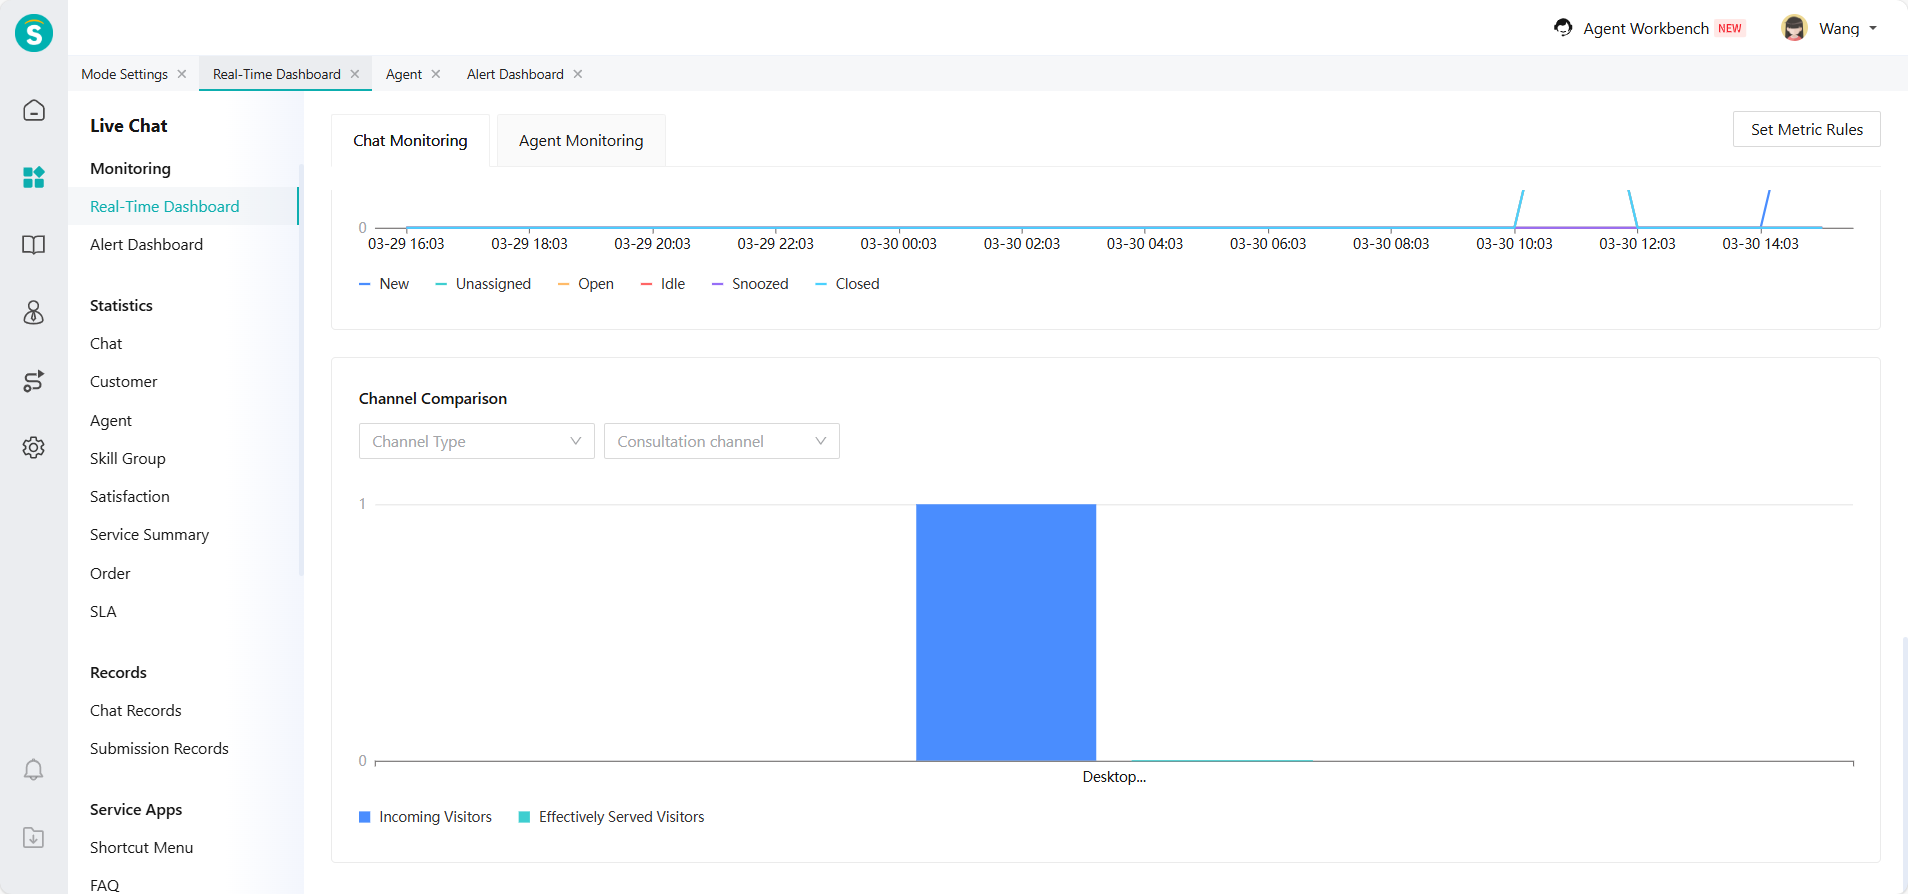
The channel comparison chart displays visitor volume and agent-handled sessions across different channels, giving managers a clear view of service performance by channel to evaluate channel value and optimize resource allocation.
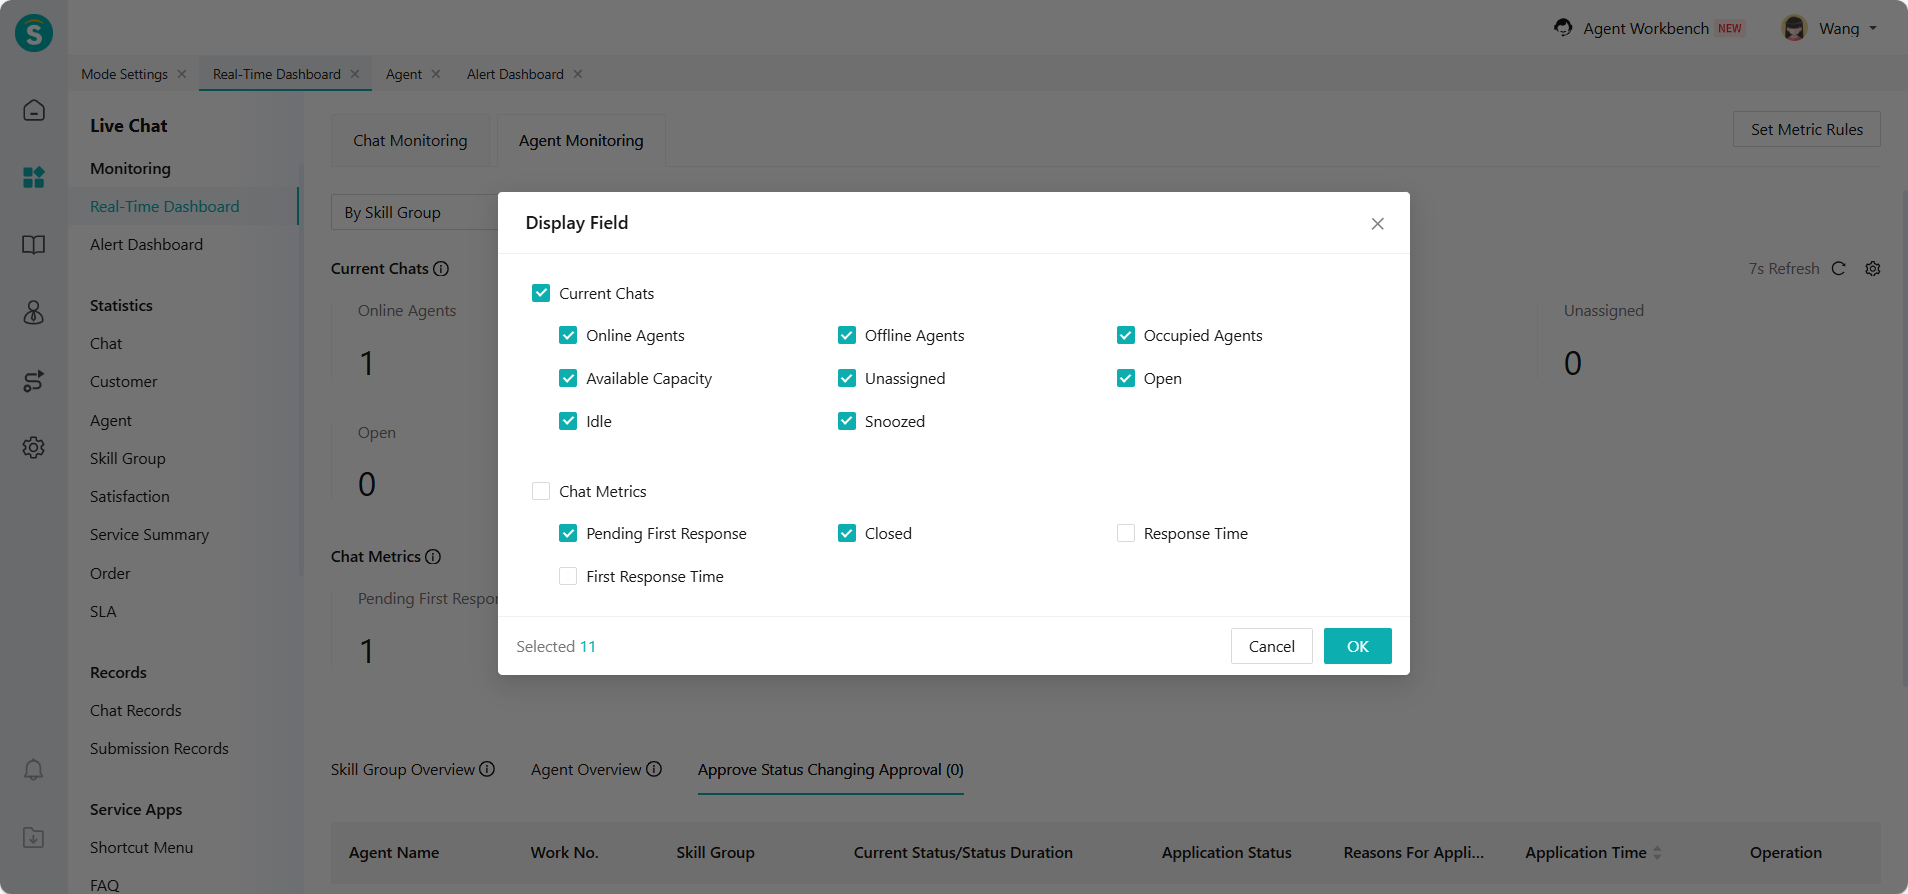
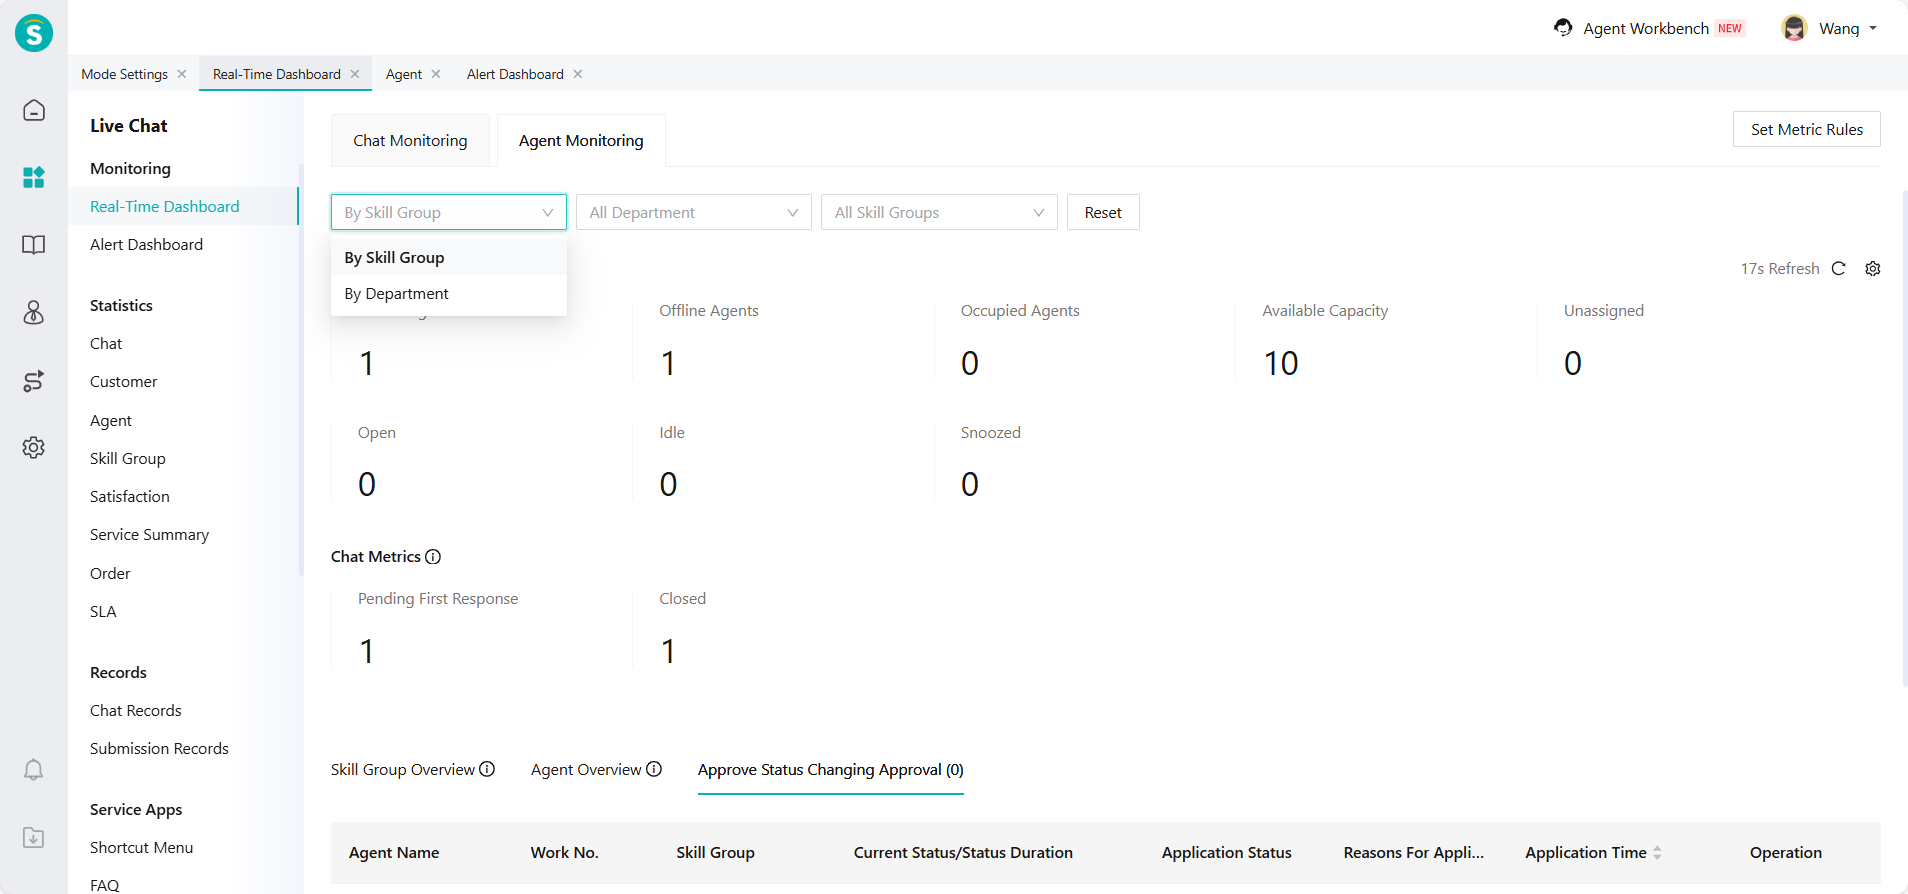
Admin can display important indicators according to business needs, and filter the monitoring range by skill group or department according to their permissions.
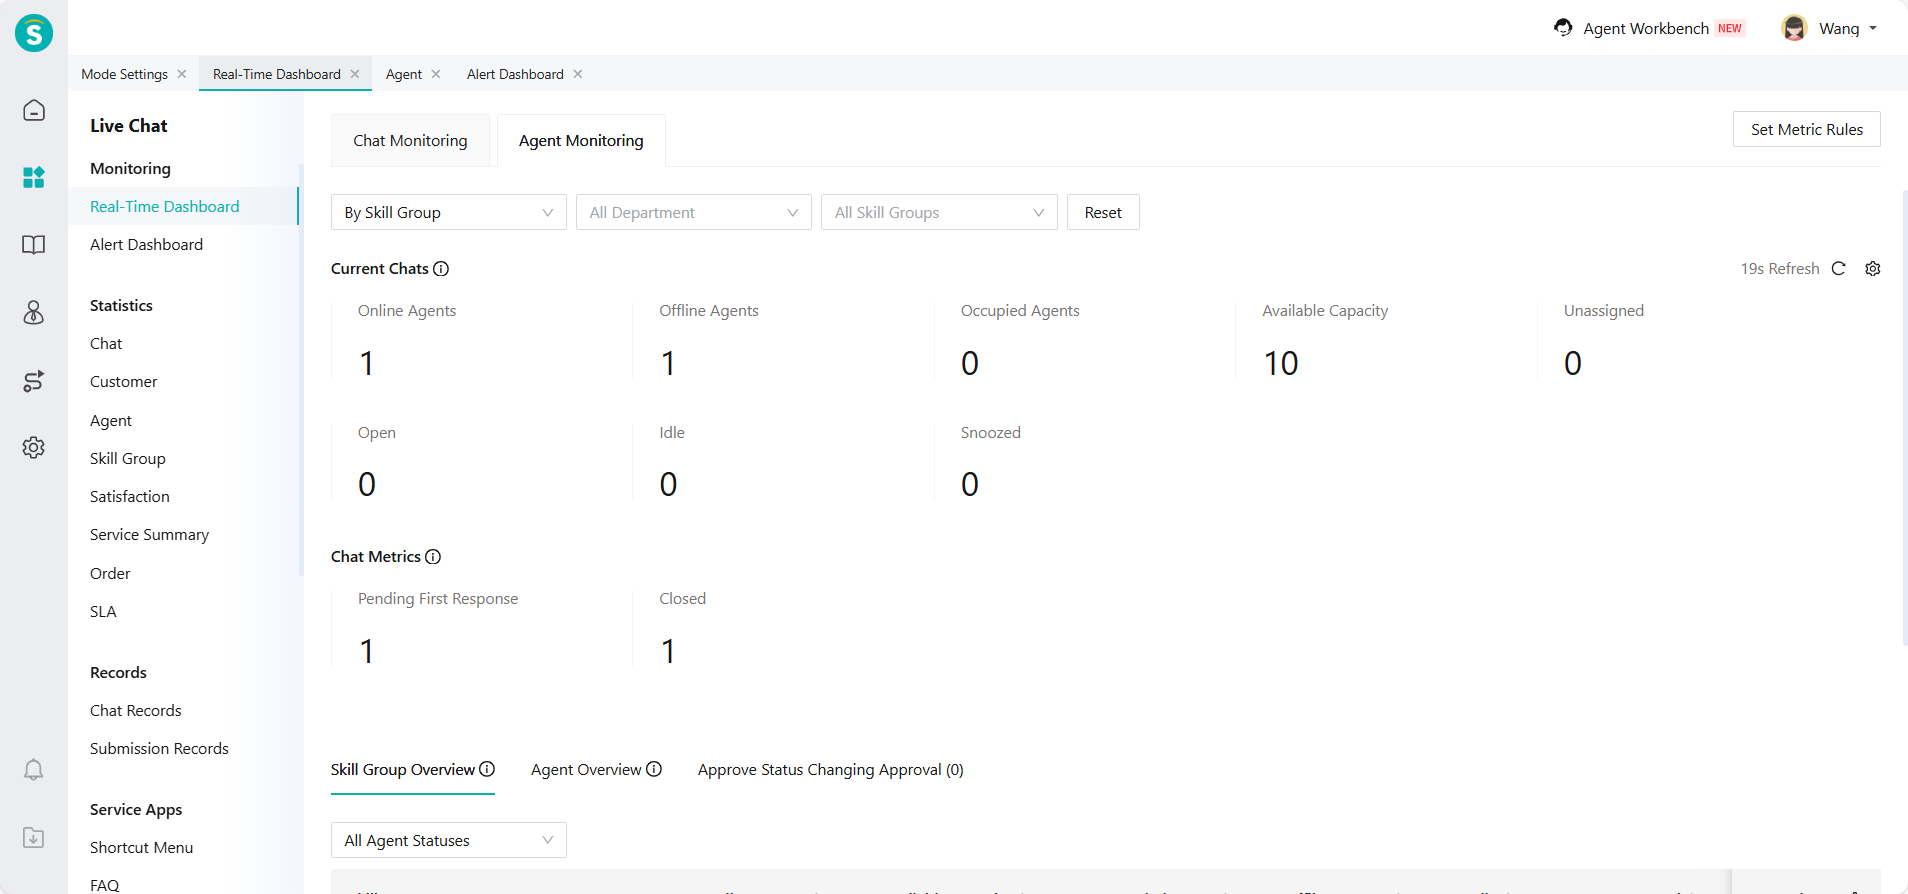
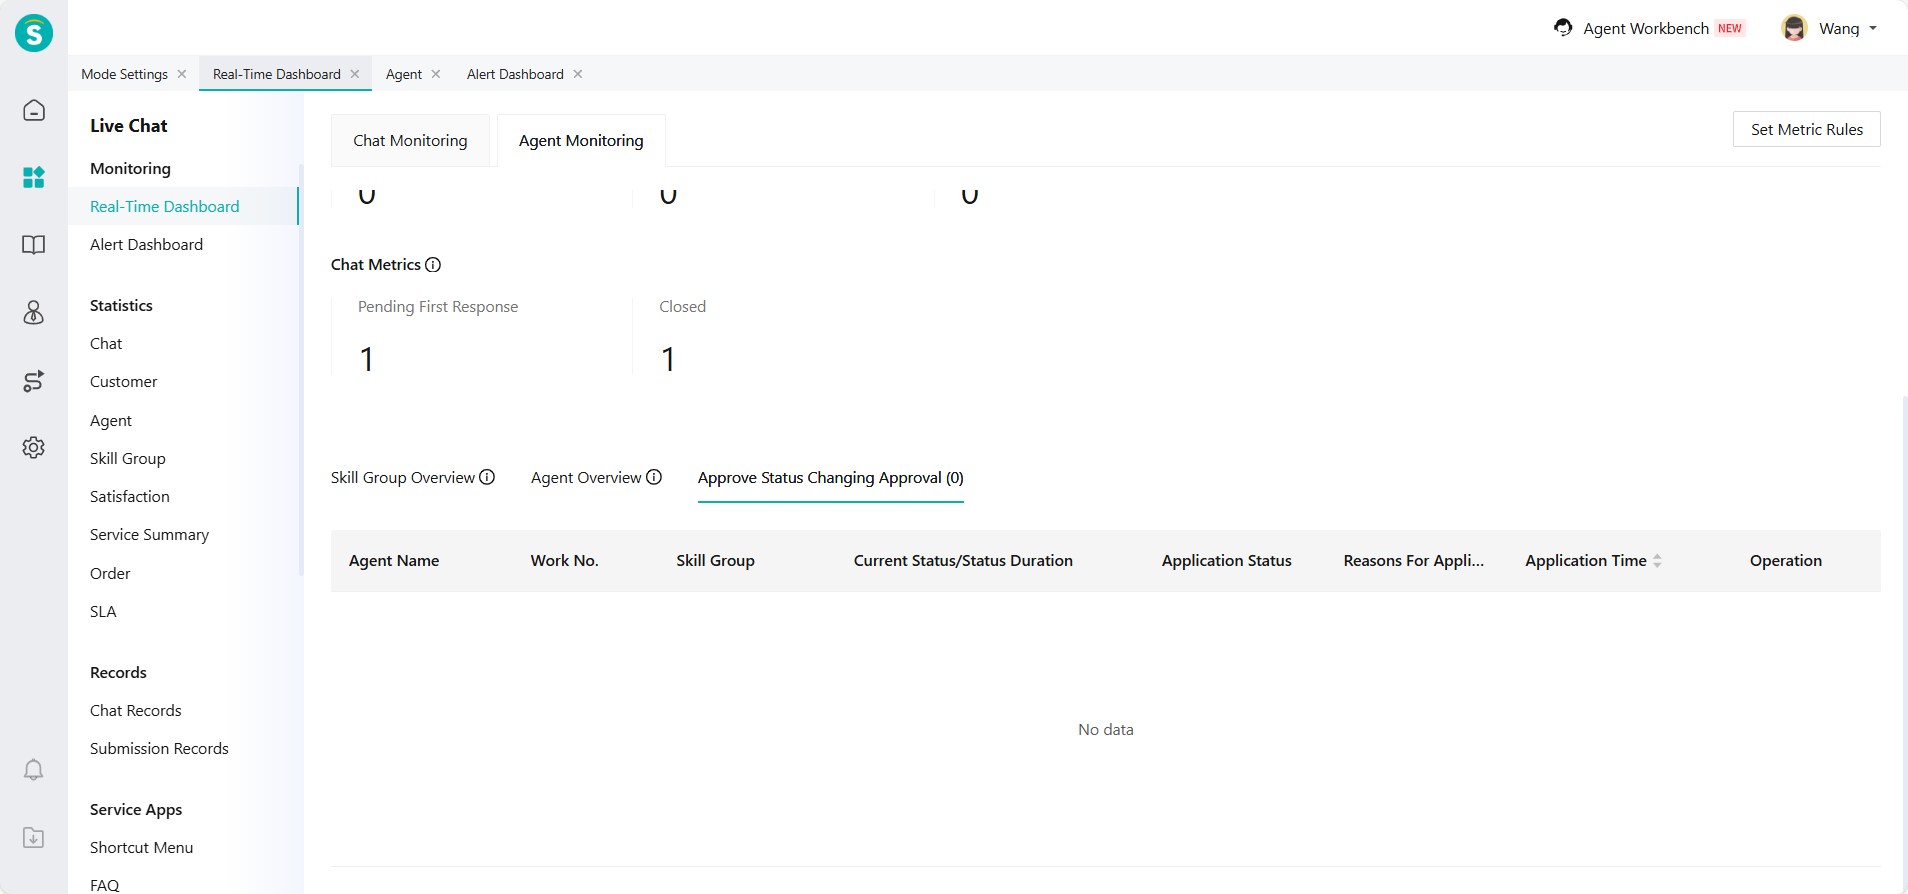
# ● Agent Monitoring
Agent monitoring displays the working status and chat load of agents in real time. It provides real-time data and monitoring information, helping administrators fully understand the operation of the agent team, promptly detect and handle abnormalities, and allocate reception resources reasonably.
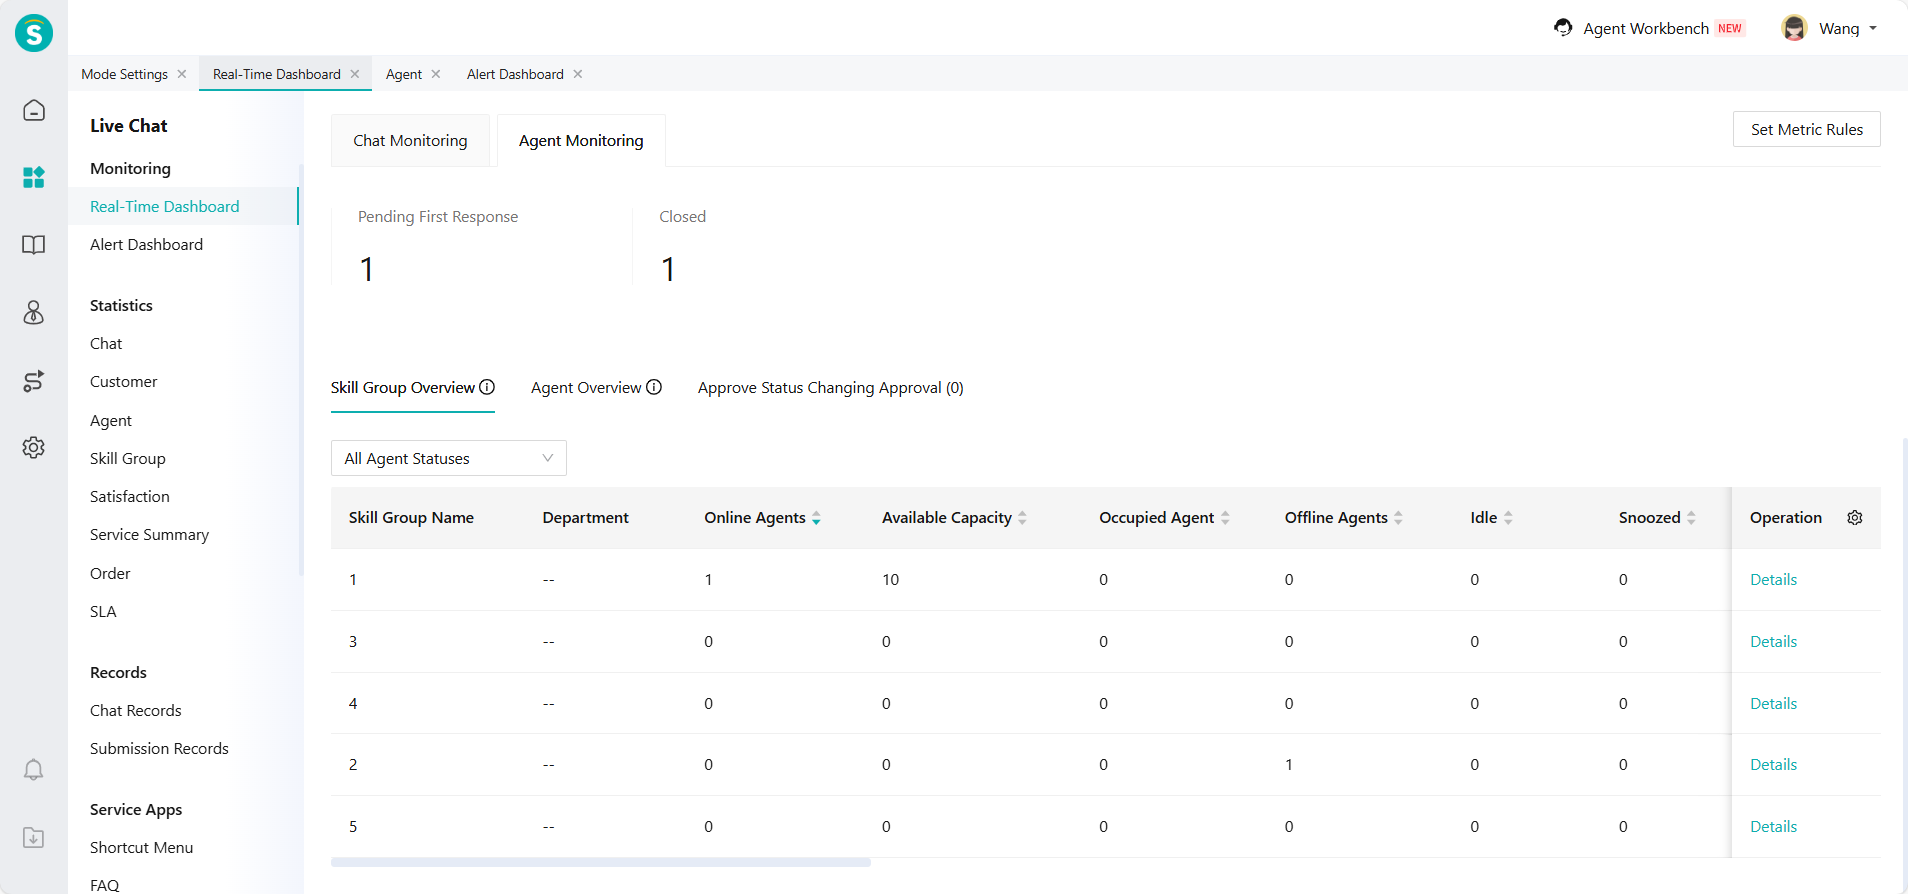
The skill group overview allow you to compare detailed data of multiple skill groups and drill down into the agent list within a skill group through 「Details」.
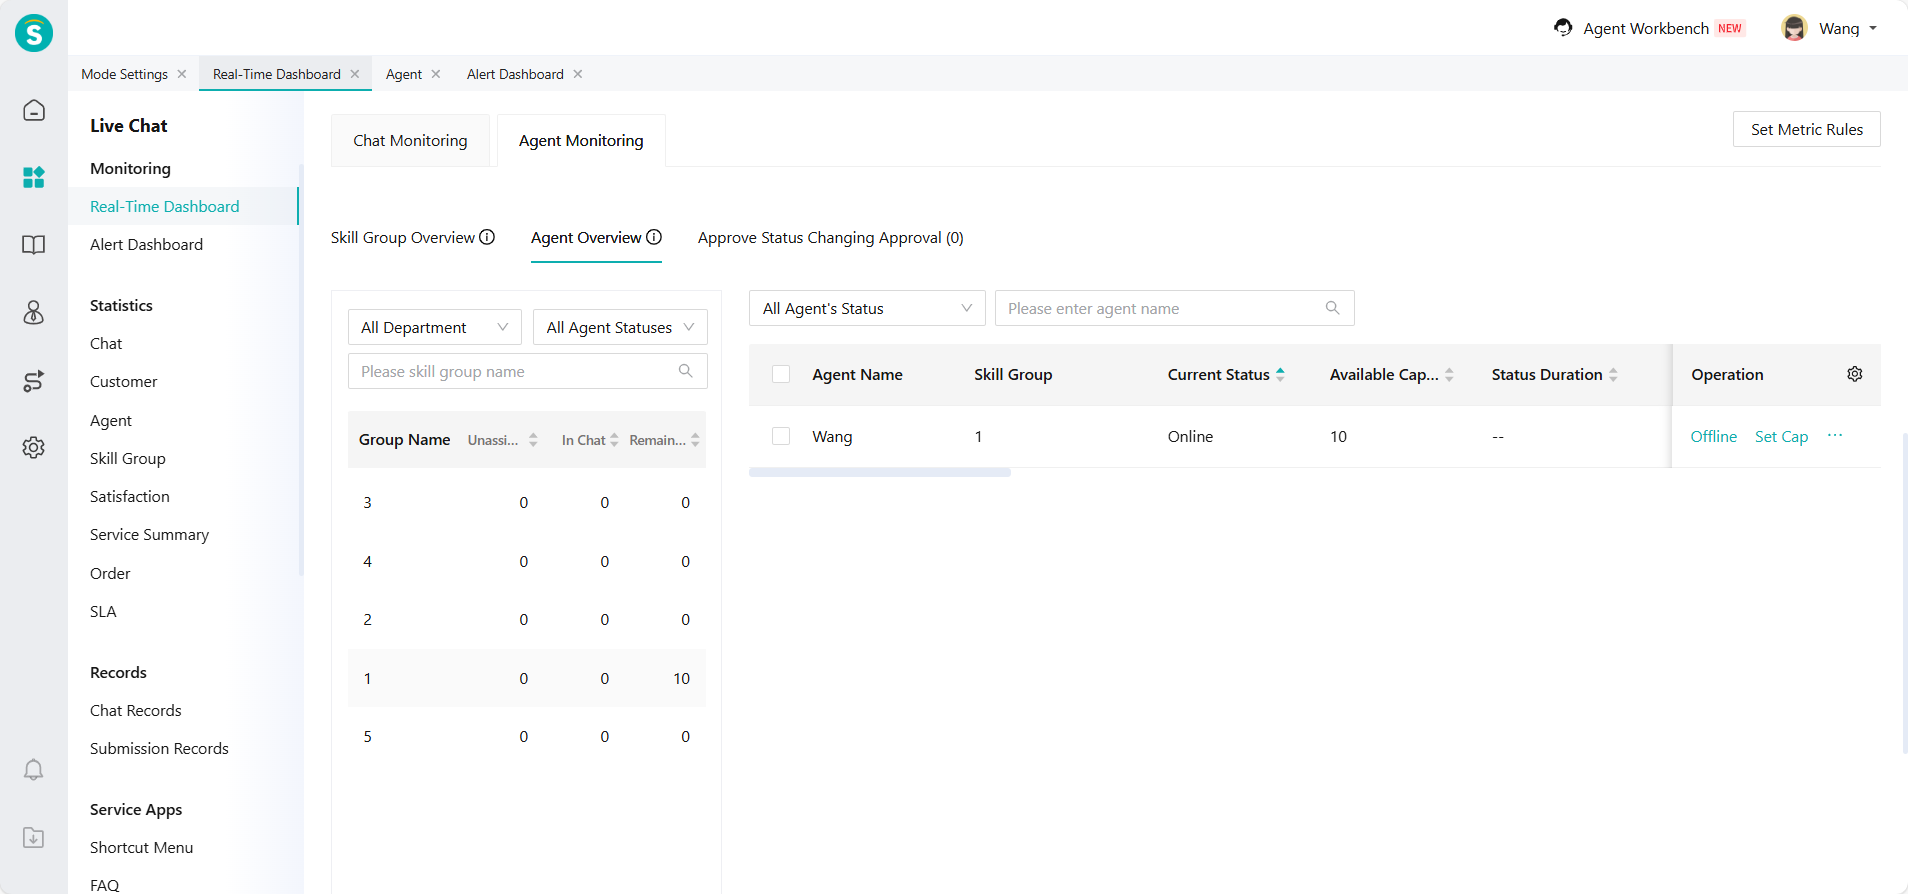
The agent overview shows the detailed data of each agent, and it can be viewed by switching through the skill group or department list on the left. Admin can quickly find agent by sorting by indicators, filtering by status or searching.
When the reception pressure is high and customers queue up, the admin can quickly modify the reception limit of agent through「Set Cap」to improve the reception ability of agent. If an agent forgets to exit the workbench after the shift change, the admin can also force the agent to exit the workbench through「Offline」.
When the Agent Status Switch Approval is enabled, the agent status can be switched only after the admin approves the application.
Admin can display important indicators according to business needs, and filter the monitoring range by skill group or department according to their permissions.
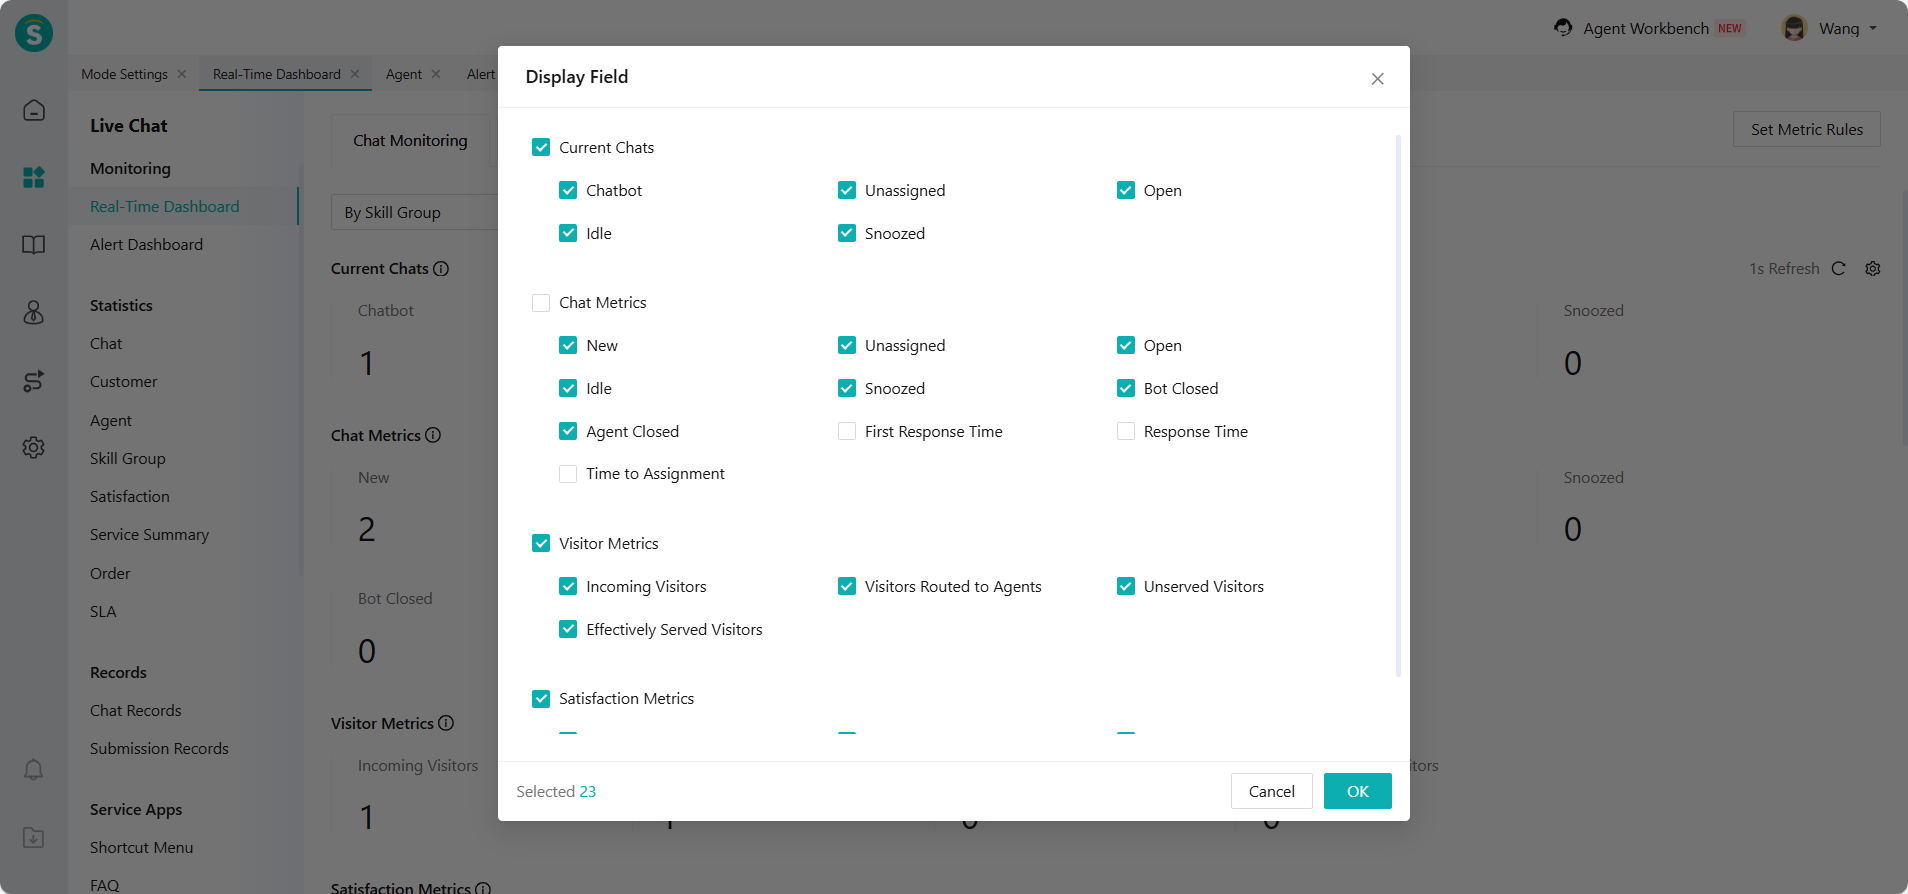
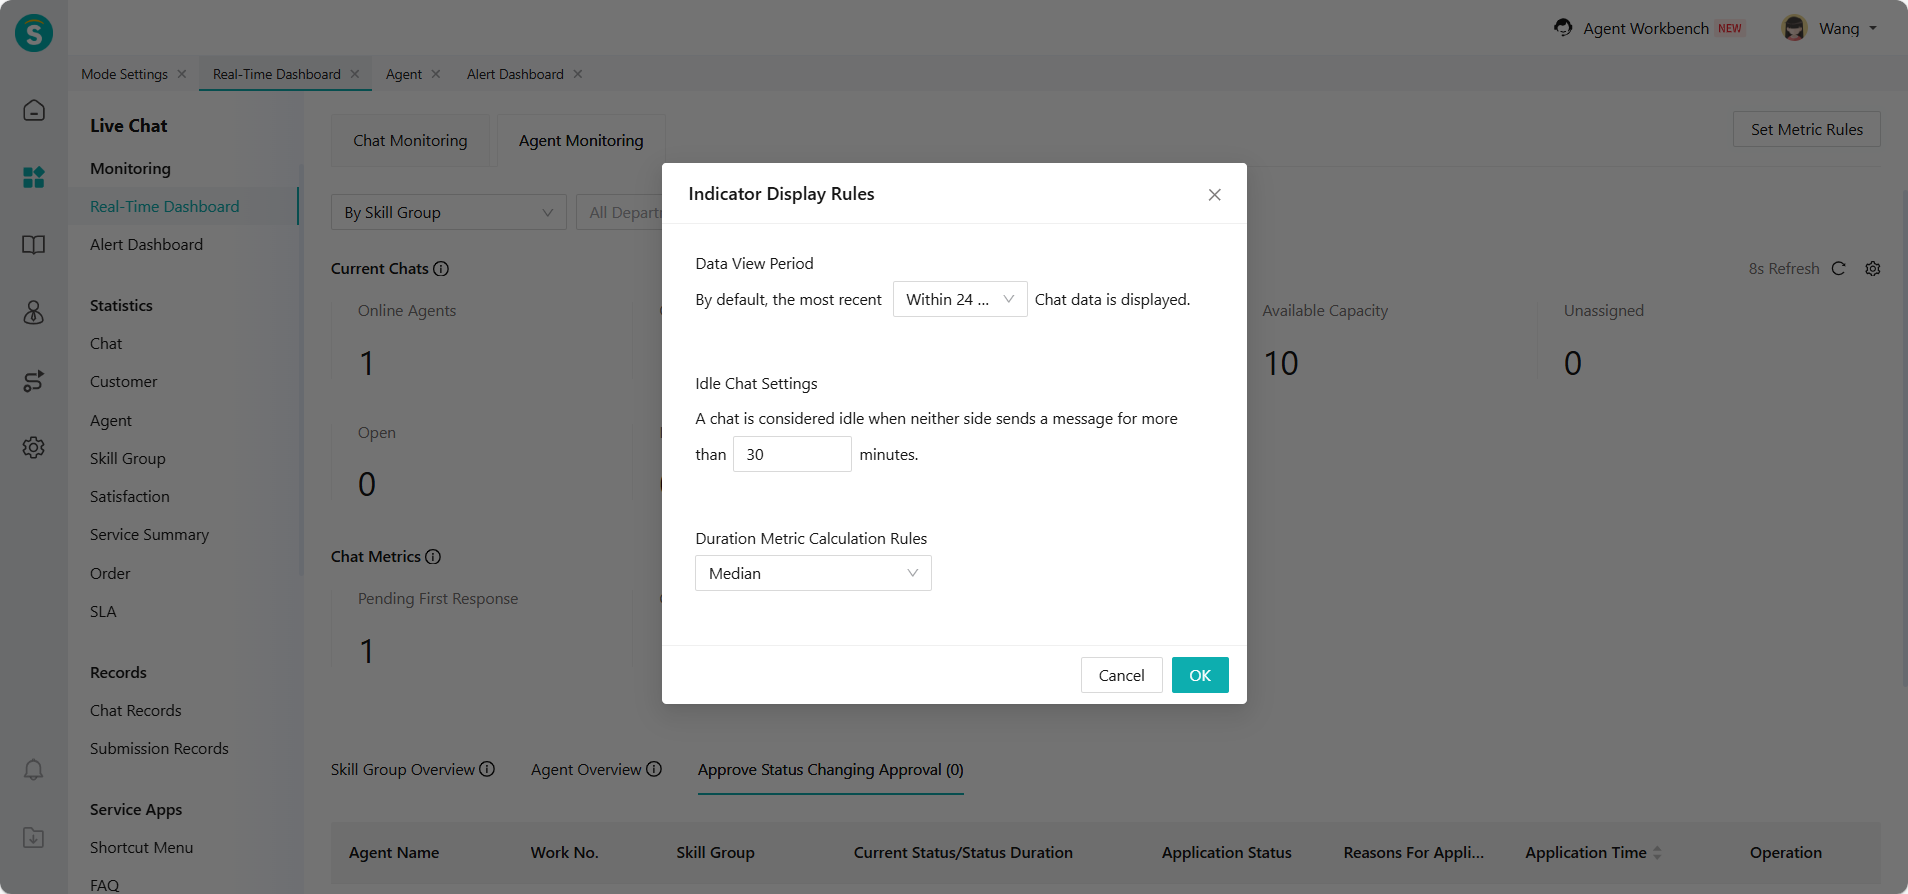
# ● Set Metric Rules
Click Set metric Rules in the top-right corner of the page to configure the data view period, idle chat settings, and duration metric calculation rules, adapting the monitoring view to different operational needs.
- 02
- Real-Time Reception Mode10-25
- 03
- Always On Mode10-25