Department Report Guide
# Department Report Guide
——This module supports querying the statistical data of inbound and outbound indicators by department and time.
# Main Functions of Department Report
# ● Indicator Query
- Support summarizing statistical indicator data by time (such as by 0.5h, hour, day, week, and month)
- Support summarizing the statistical data by department (display different departments and their statistical indicator values)
- Support summarizing the statistical data by department + time (display the indicator values of each department summarized by 0.5h, hour, day, week and month). For example, it supports comparing daily, weekly and monthly indicator values under the same department.
- Support querying statistical indicators of department inbound and outbound calls.
- Support filtering the statistical data by time node (e.g., only query data of 08:00 - 12:00 every day)
- Support displaying total data at the bottom of table and exporting the data.
- Support users to customize indicator display scheme (store report schemes for querying various indicators in different scenarios)
- Support departments to manage their own data (data isolation)
# ● Customize Indicator Display Scheme
- Support users to customize a set of overview area indicator display scheme, and support the simultaneous display of inbound, outbound and work status indicators.
- Support users to customize multiple sets of list indicator display schemes according to different scenarios. For example: create a set of "answer % indicator display scheme" and a set of "call loss indicator display scheme".
# ● Custom Kanban
Support users to create custom graphic kanban. Kanban supports bar chart, line chart, report and other forms, facilitating users to analyze data according to the Kanban of different businesses. For detailed function introduction, please view: Report Custom Kanban Guide
# How to Use Department Report
# ● View Indicators by Summaries of Different Dimensions
Support viewing indicators by summaries by time, department, time + department, and department + time.
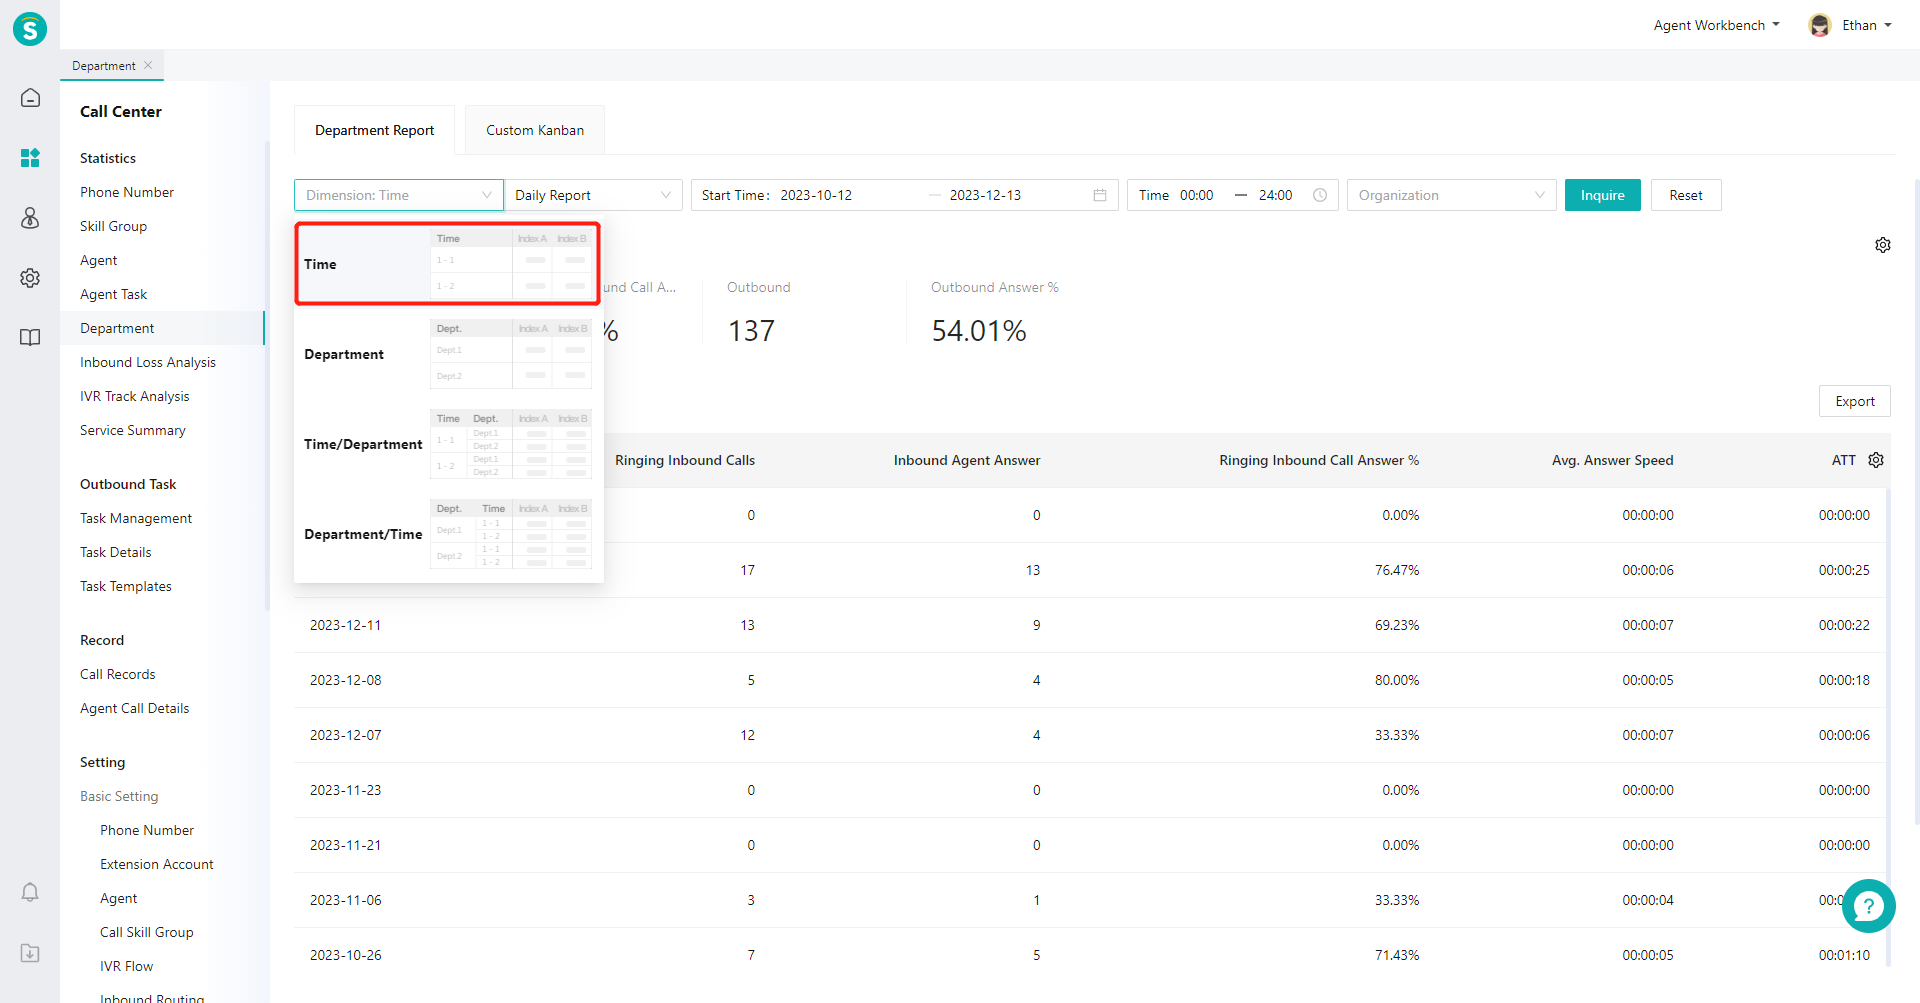
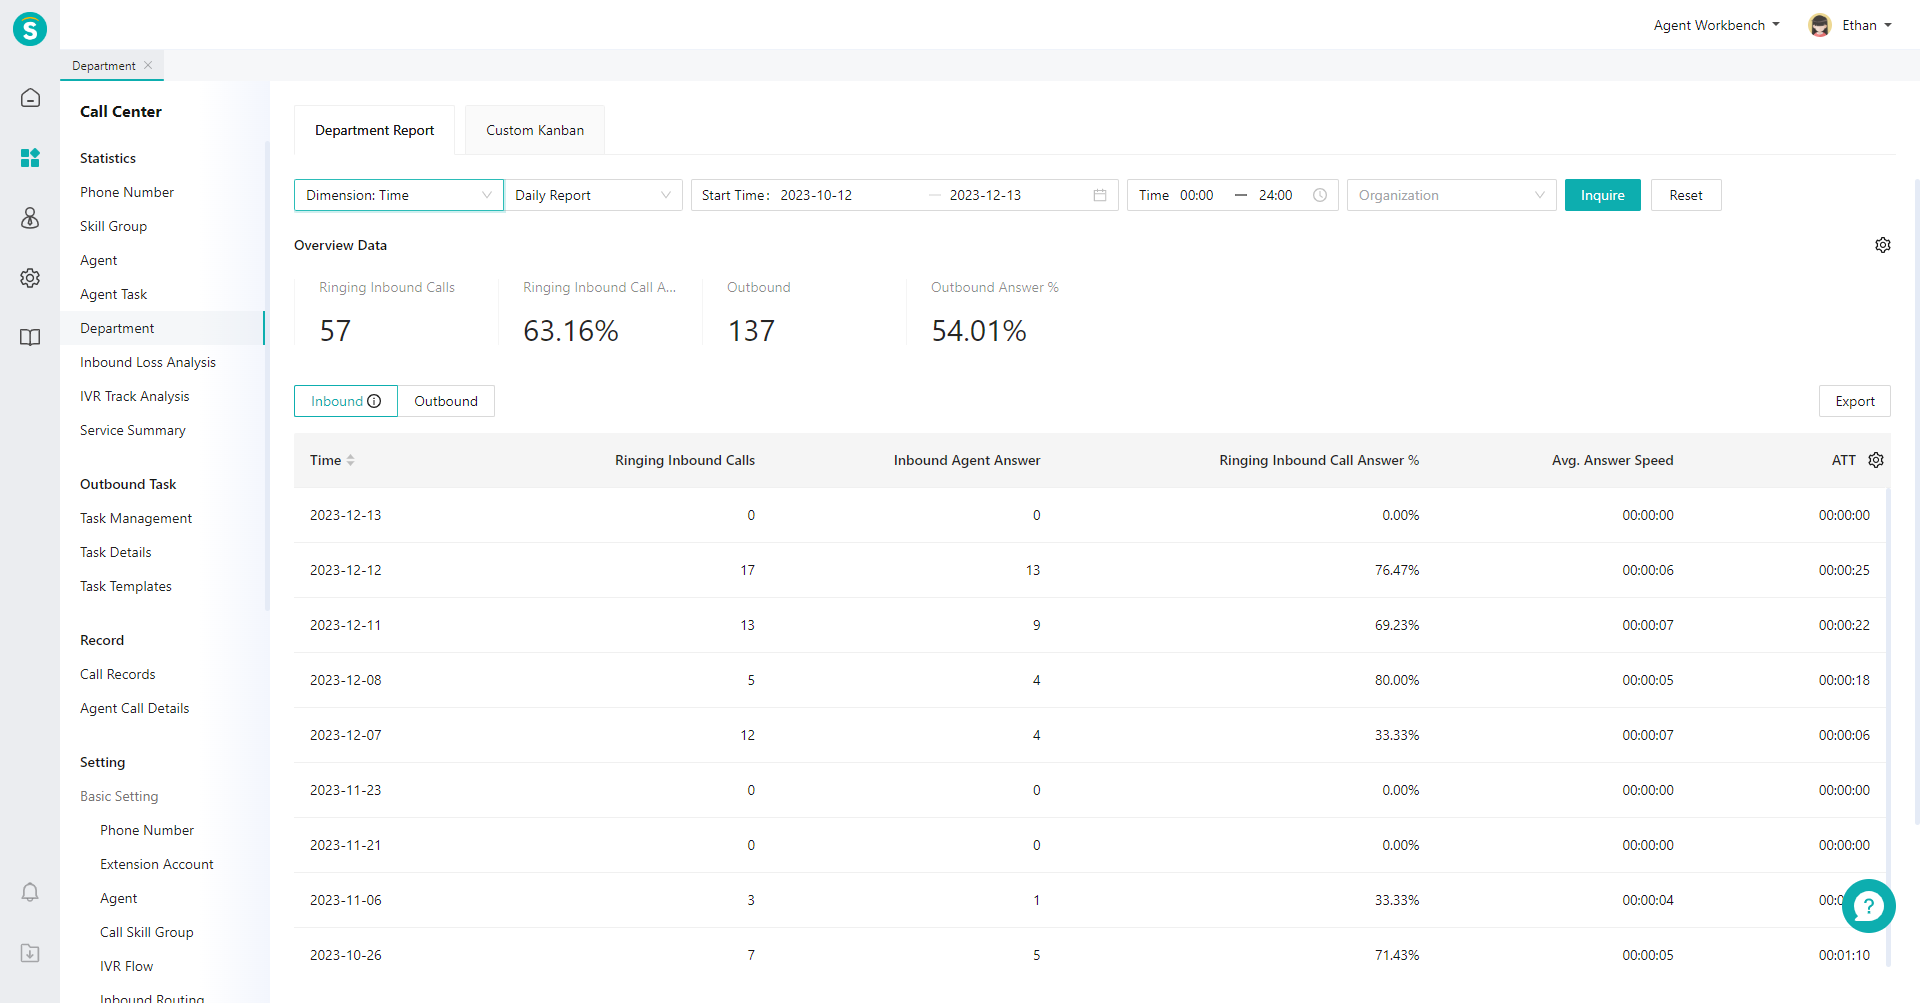
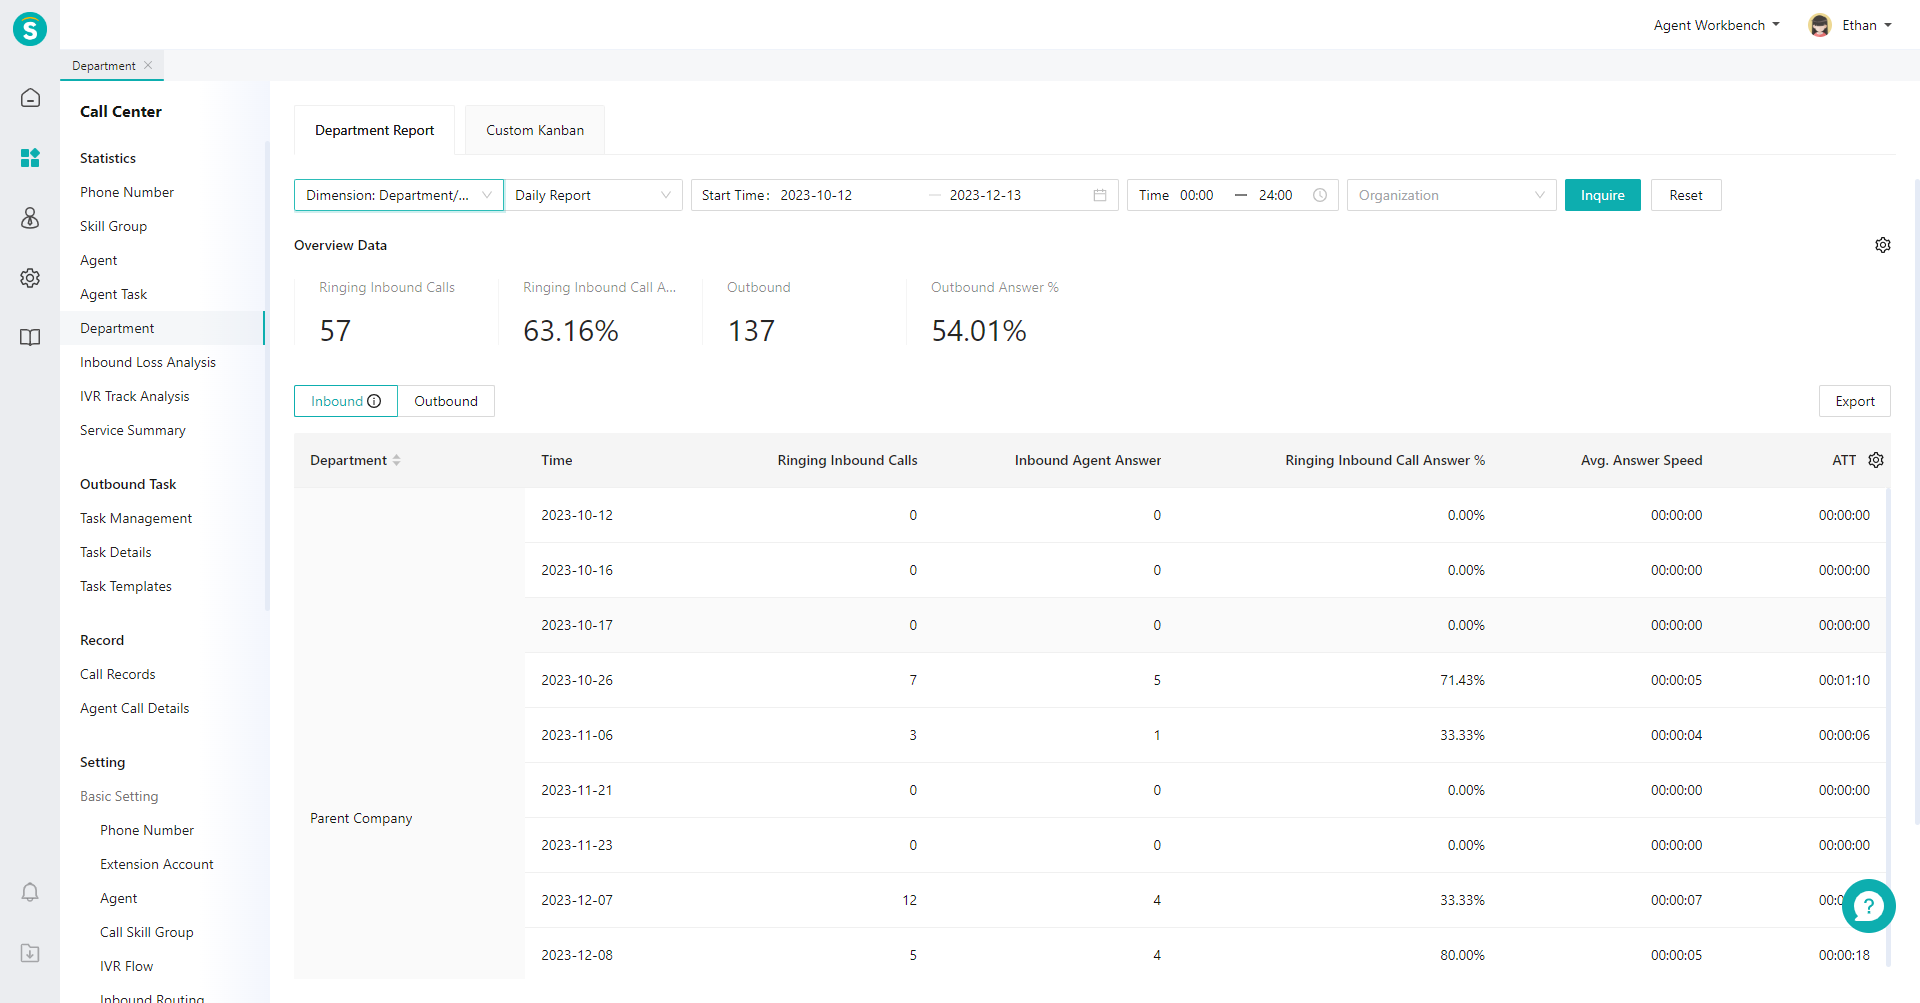
- Summary by time: In the top filter item, select "Time" for dimension and "Daily Report" for time type, and then click【Query】(Figure 1). View the daily summary data in the list (Figure 2).
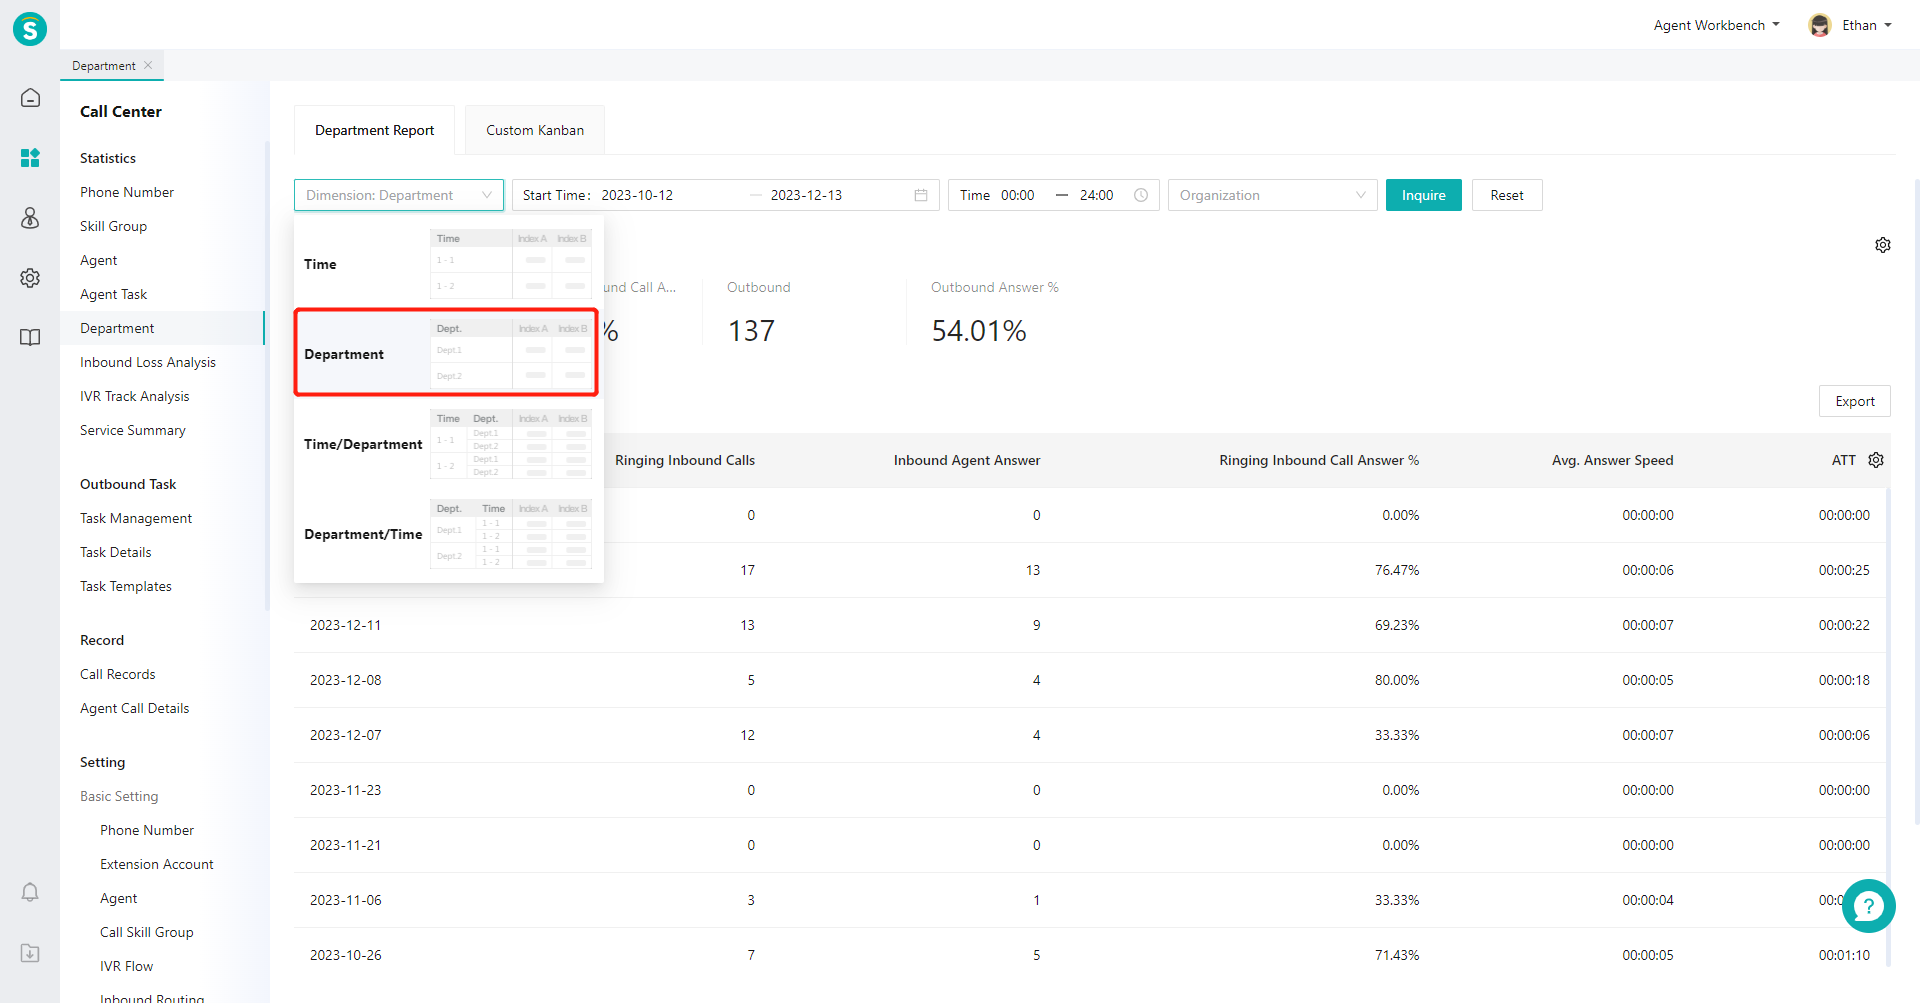
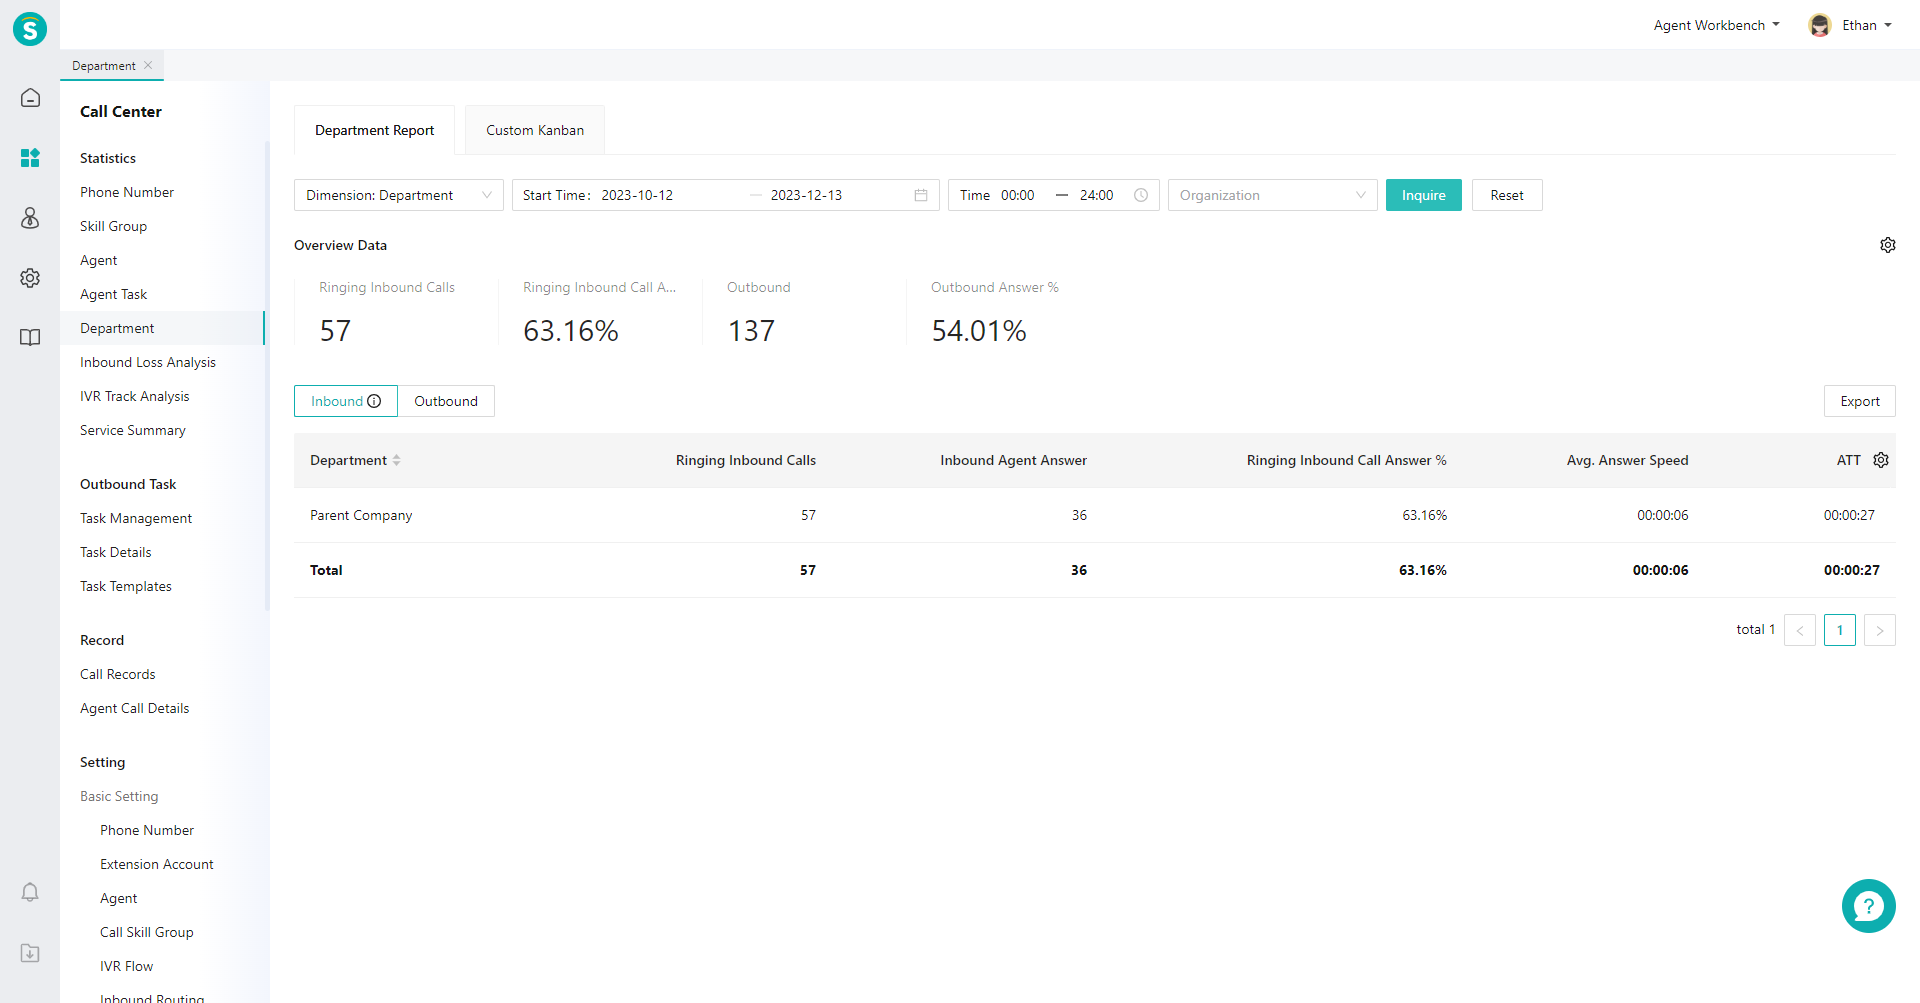
- Summary by department: In the top filter item, select「Department」for the dimension, and then click【Query】(Figure 3). View the summary data of each department in the list (Figure 4);
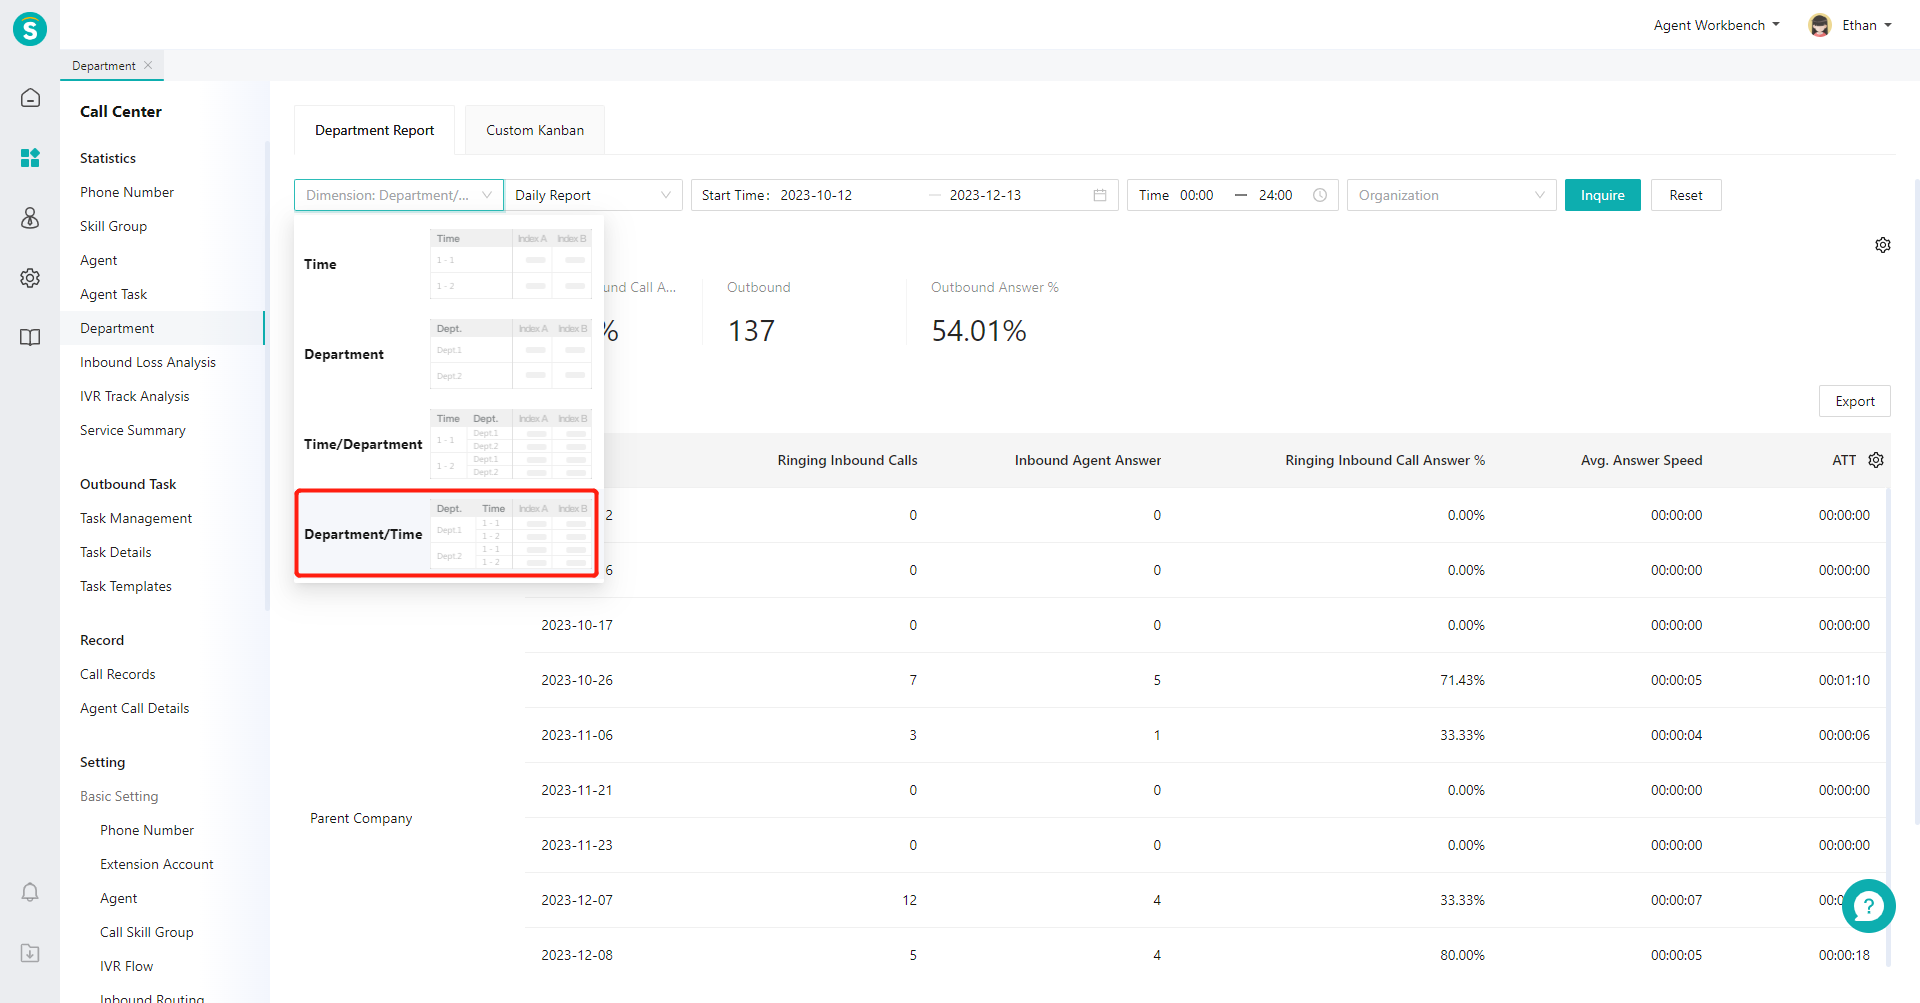
- Summary by department + time: In the top filter item, select "Department/Time" for dimension and "Daily Report" for time type, and then click【Query】(Figure 5). View the daily summary data of each department in the list (Figure 6);
# ● View Indicator Description
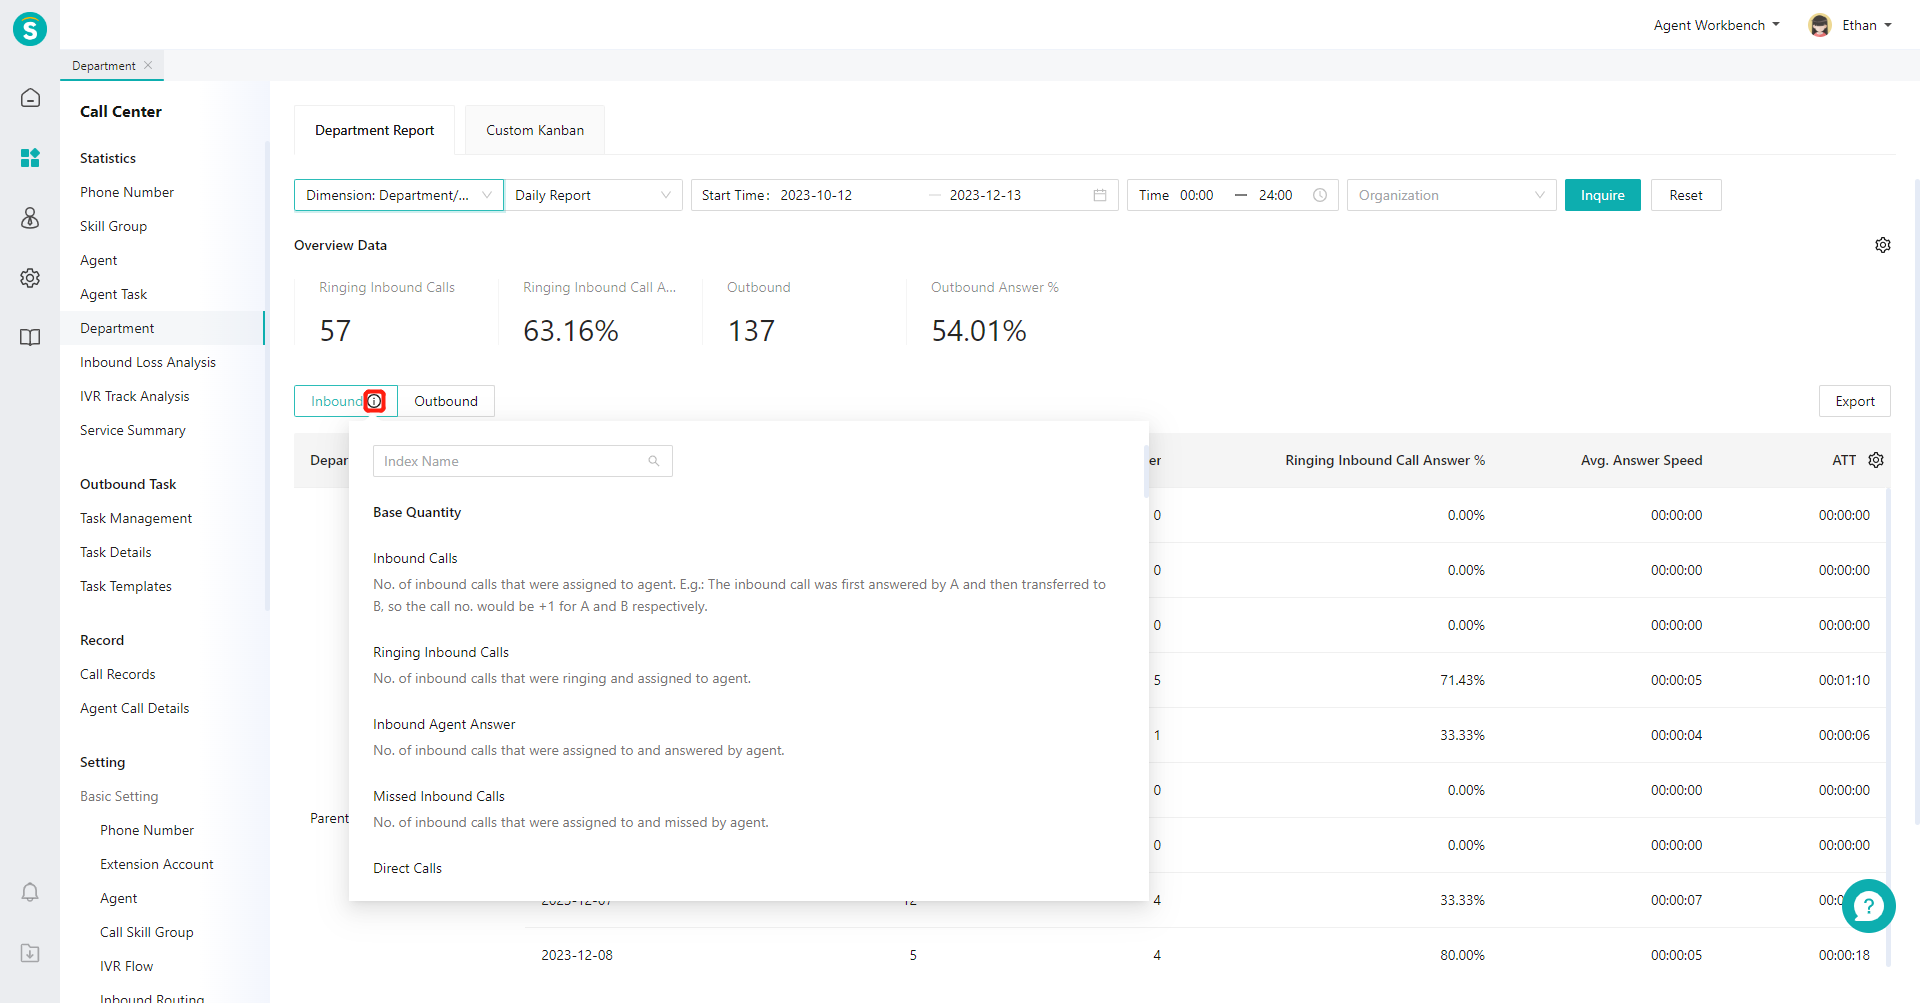
Move the mouse to the "Details" icon next to the inbound and outbound calls and expand the indicator description bubble (Figure 7).
# ● Create Custom Indicator Scheme
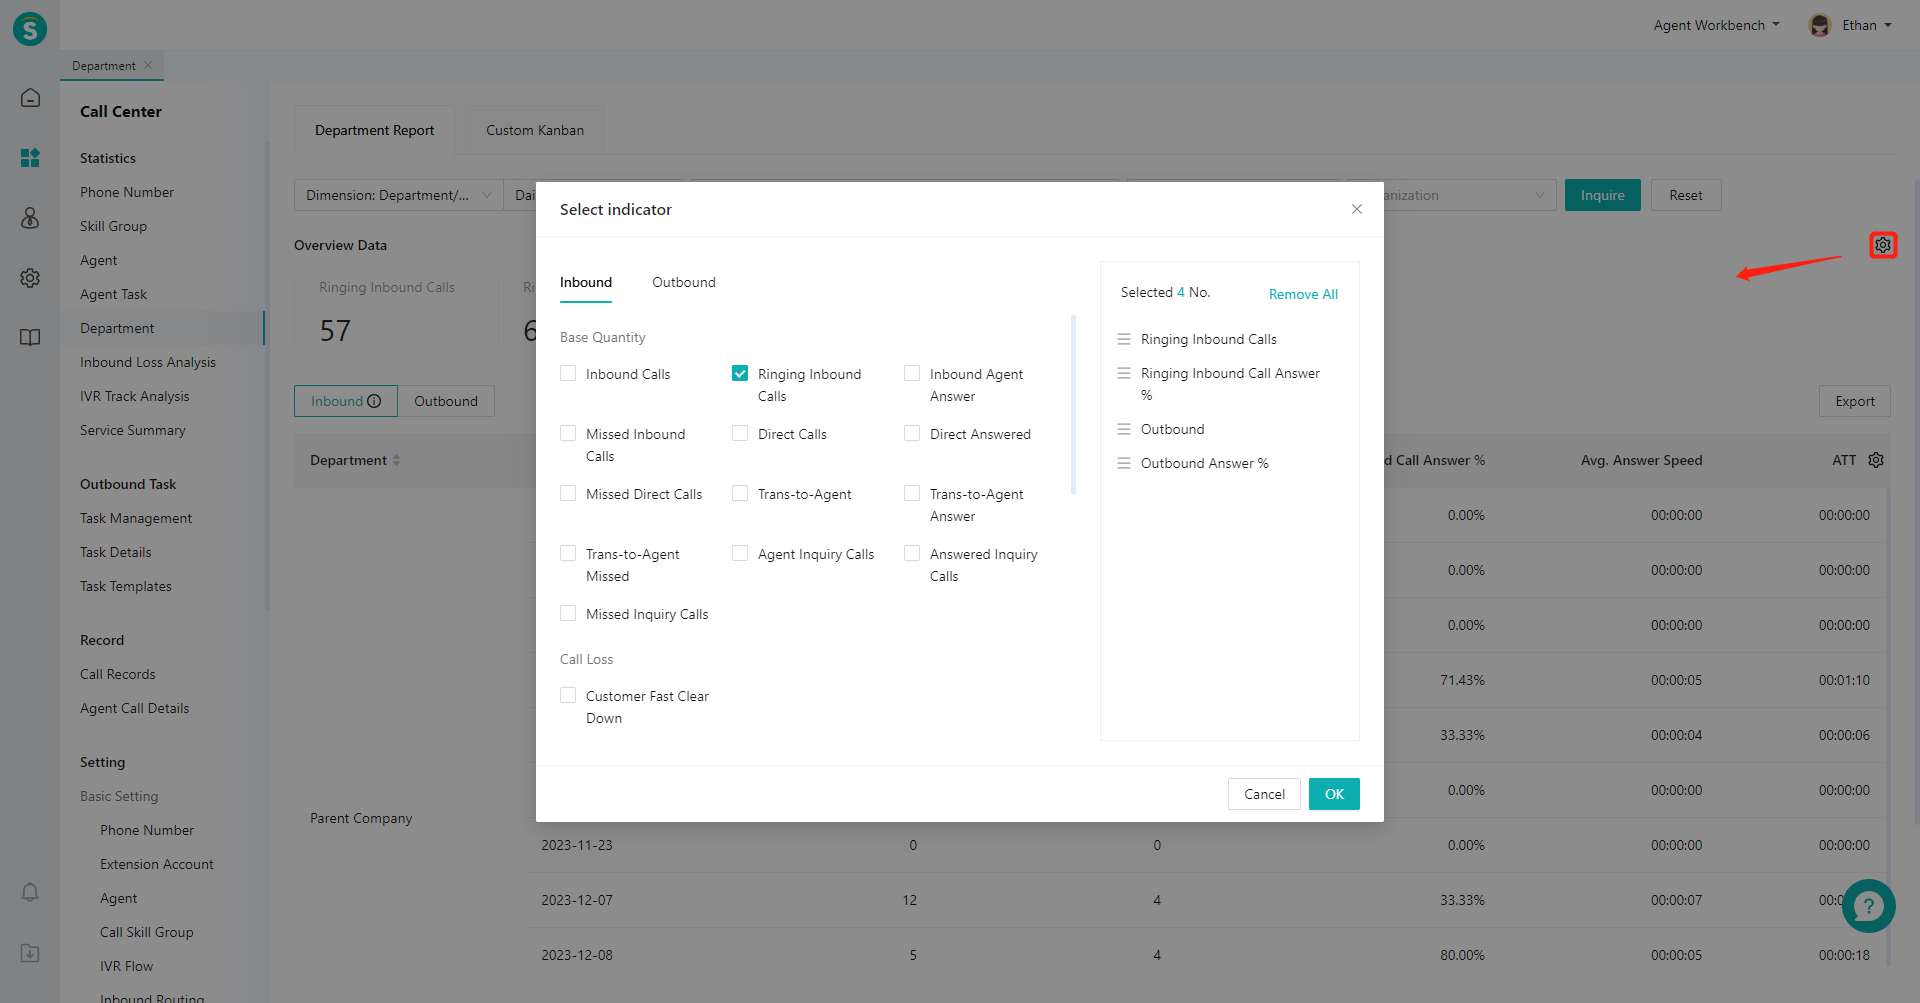
- Click the gear-shaped button on the right side of the overview area to expand the scheme list, select indicators on the left side of the pop-up window, and sort the selected indicators on the right side (Figure 8).
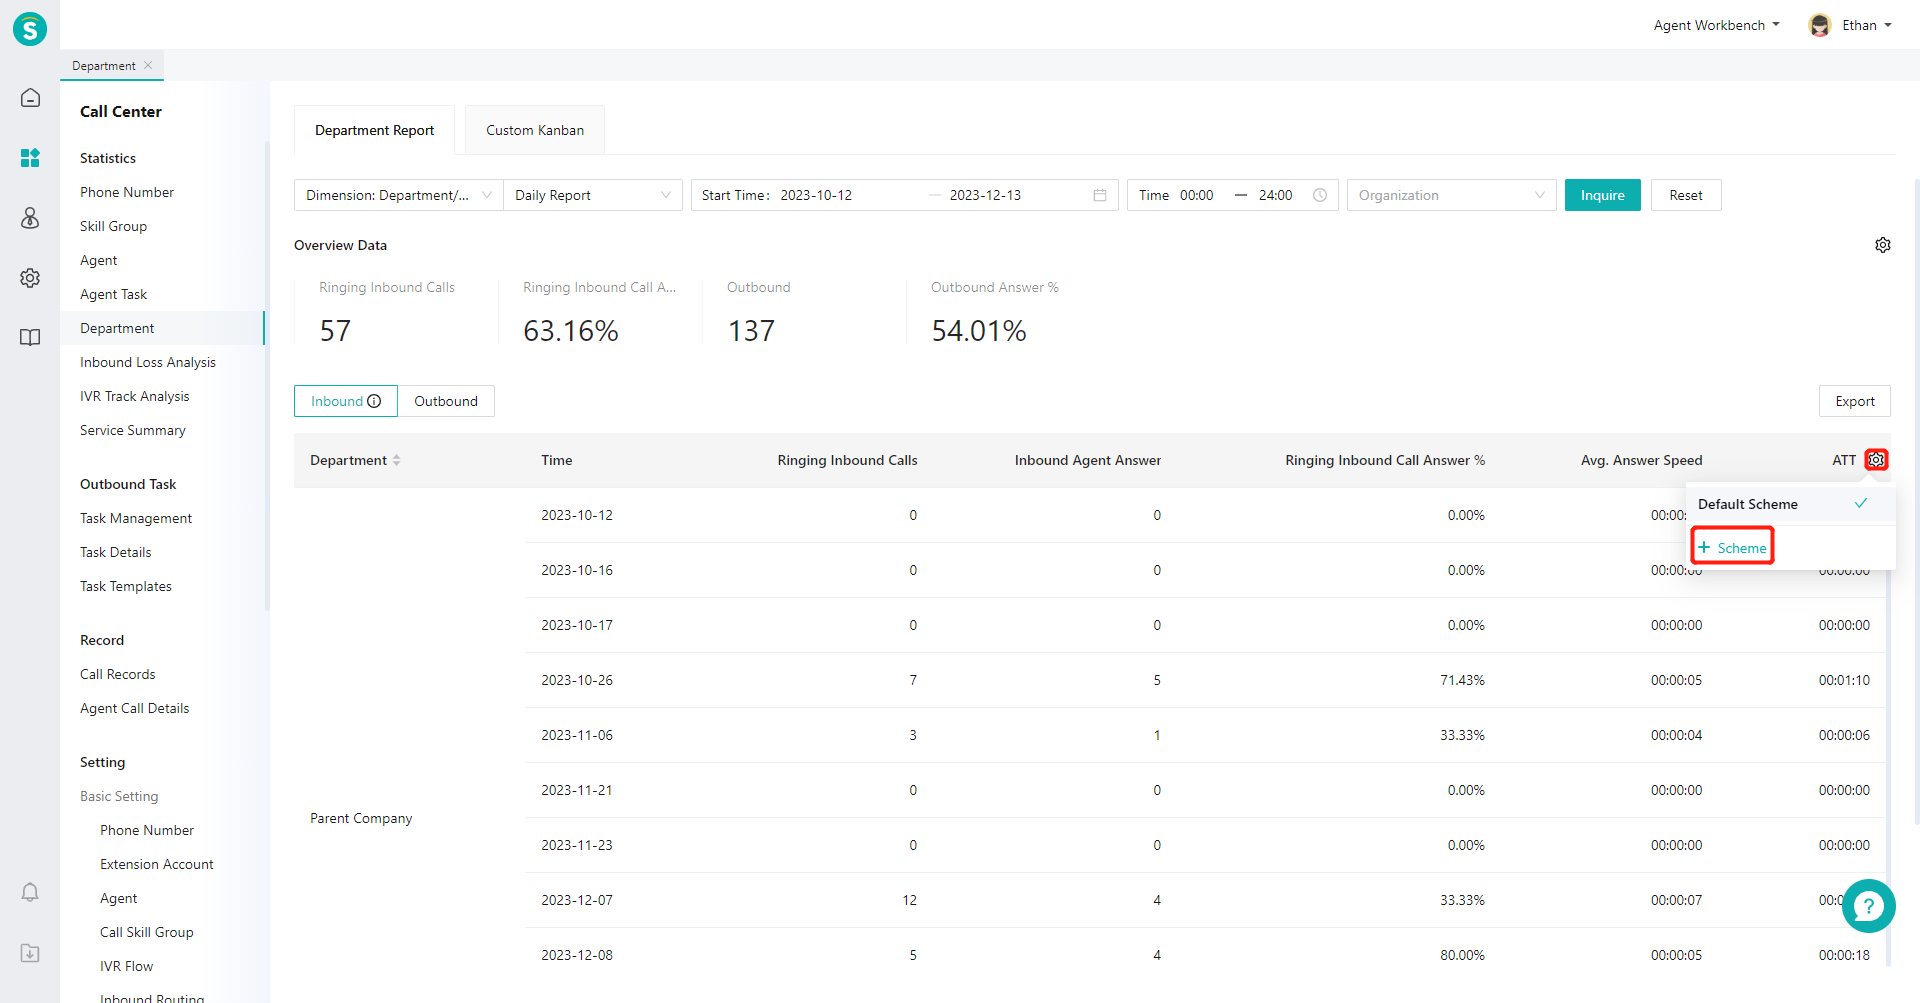
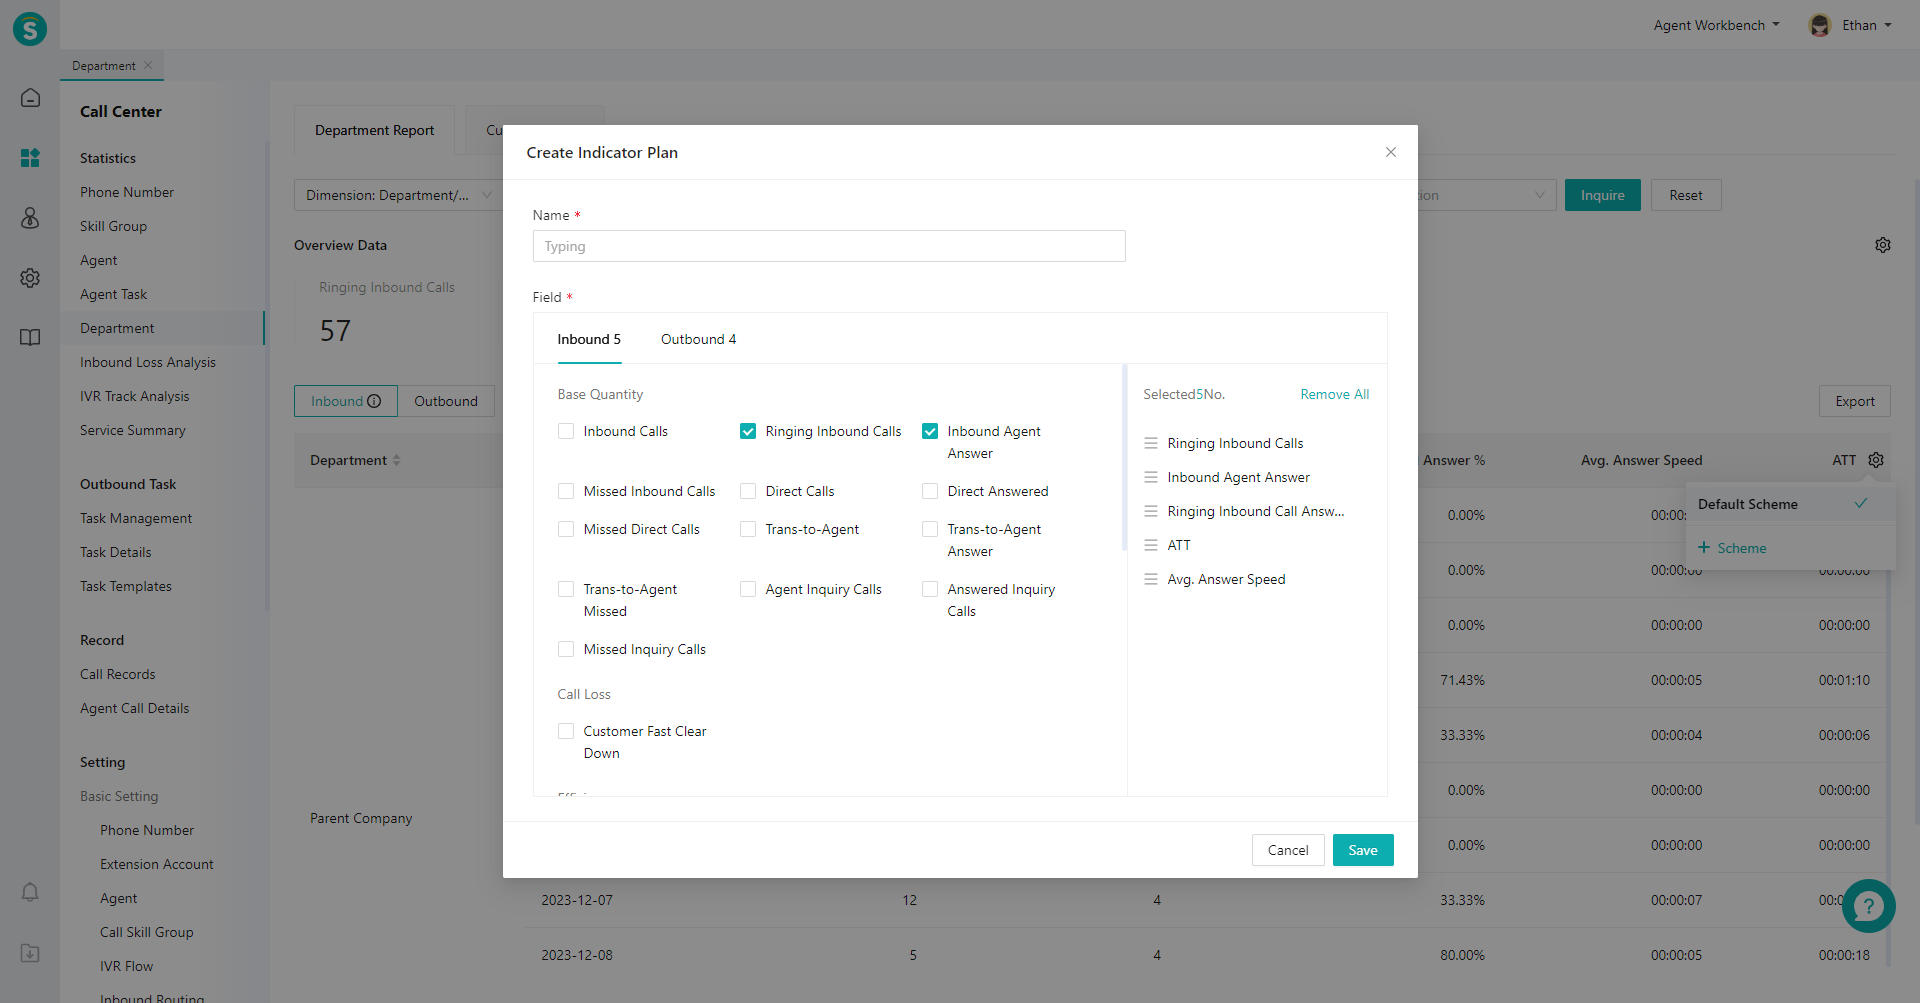
- Click the gear-shaped button on the right side of the list to expand the scheme list, and click【+Scheme】(Figure 9). In the pop-up window, select indicators on the left side and sort the selected indicators on the right side (Figure 10).
Last Updated: 11/18/2024, 7:17:07 PM