Inbound Loss Analysis Guide
# Inbound Loss Analysis Guide
——Learn how to query the statistical data of the call loss indicators of relay numbers and skill groups by relay number, skill group and time through this article.
# Main Functions of Inbound Loss Analysis
# ● Indicator Query
- Support summarizing statistical indicator data by time (such as by 0.5h, hour, day, week, and month) for relay number call loss report and skill group call loss report.
- Support summarizing the statistical data of call loss indicators by relay number (display different relay numbers and different call loss indicator values) for the relay number call loss report. For example, support viewing the comparison of call loss rates of multiple relay numbers. Support summarizing statistical data of call loss indicators by skill group (display different skill groups and different call loss indicator values) for the skill group call loss report. For example, support viewing the comparison of call loss rates of multiple skill groups.
- Support summarizing statistical data of call loss indicators by relay number + time for the relay number report. Display the call loss indicator values of each relay number summarized by 0.5h, hour, day, week and month. For example, it supports comparing daily, weekly and monthly call loss indicator values of the same relay number. Support summarizing statistical data of call loss indicators by skill group + time for the skill group call loss report. Display call loss indicator values of each skill group summarized by 0.5h, hour, day, week and month. For example, it supports comparing daily, weekly and monthly call loss indicator values of the same skill group.
- Support filtering statistical data by time node (e.g., only query data of 09:00 - 18:00 every day) for the relay number report and the skill group call loss report.
# ● Customize Indicator Display Scheme
Users can customize an indicator display scheme for the overview area, chart area and list respectively for the relay number call loss report and the skill group call loss report.
# How to Use Inbound Loss Analysis
The relay number call loss report and the skill group call loss report are basically used in the same way. Take the skill group call loss report as an example in the following usage instructions.
# ● View Indicators Summarized by Different Dimensions
- Support viewing indicators summarized by time, relay number, time + relay number, and relay number + time for the relay number call loss report. Support viewing indicators summarized by time, skill group, time + skill group, and skill group + time for the skill group call loss report.
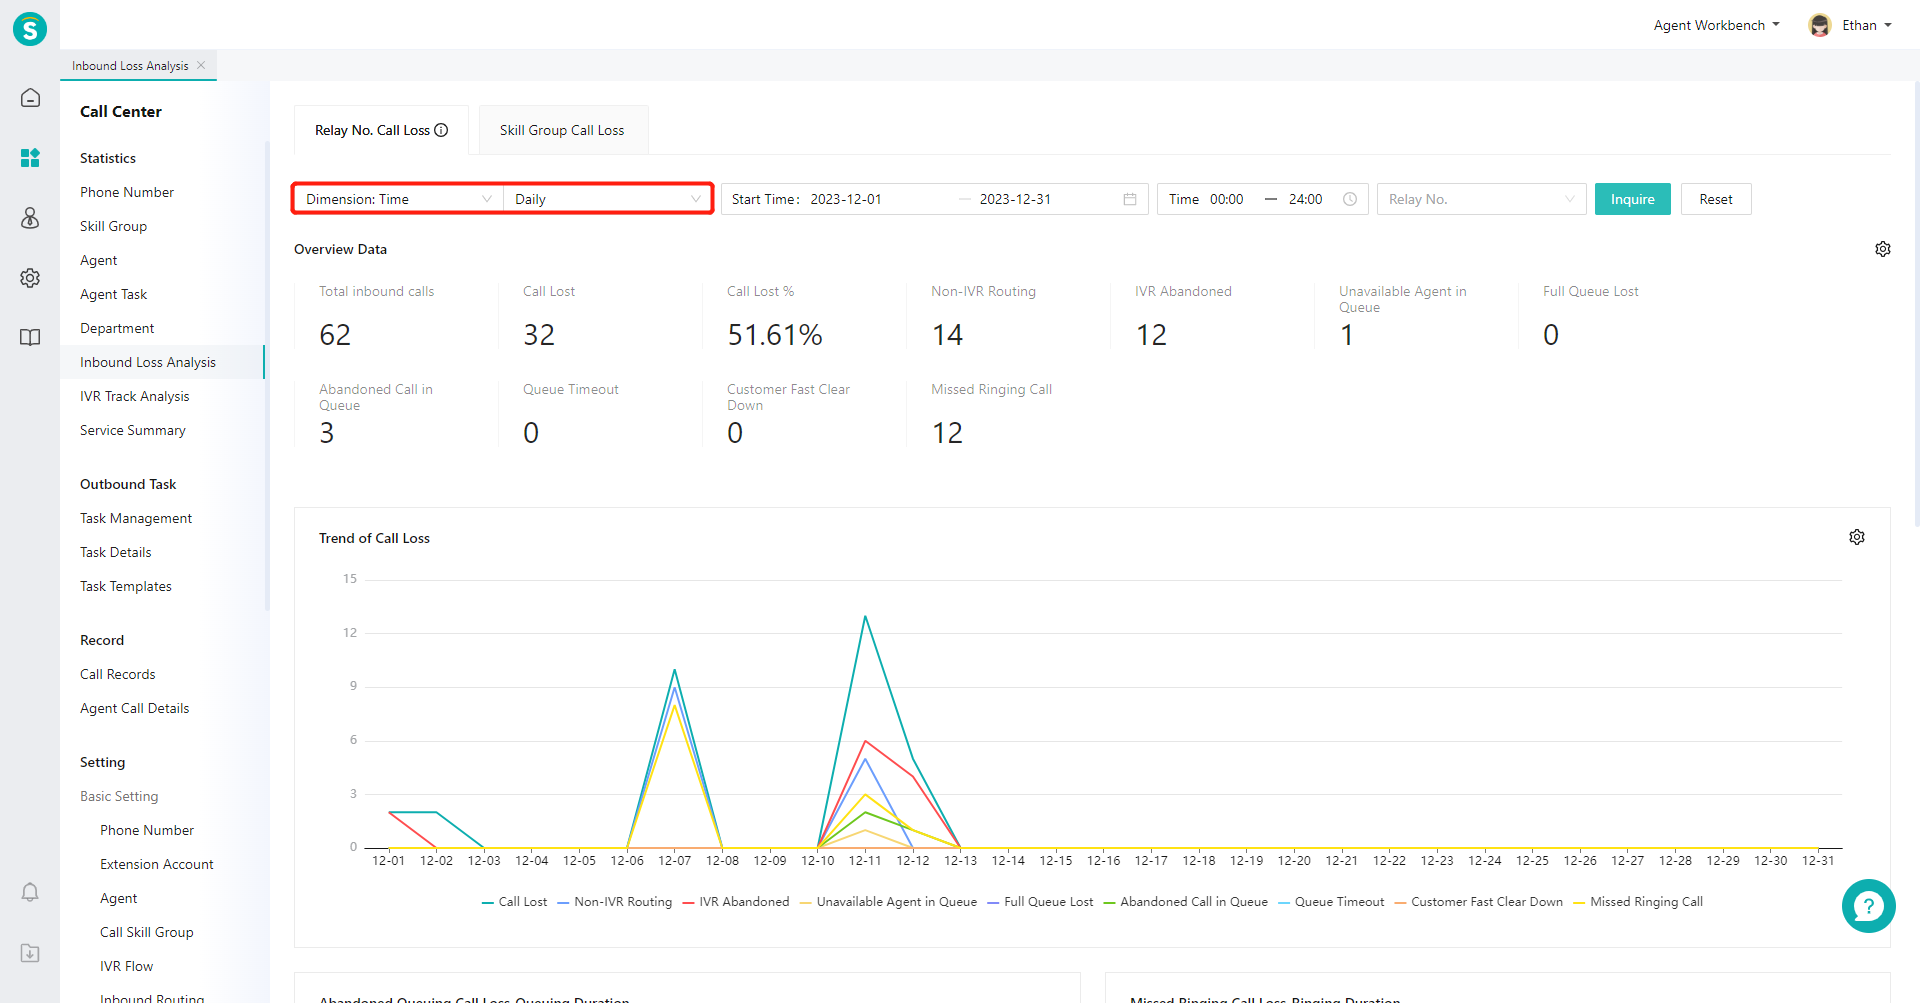
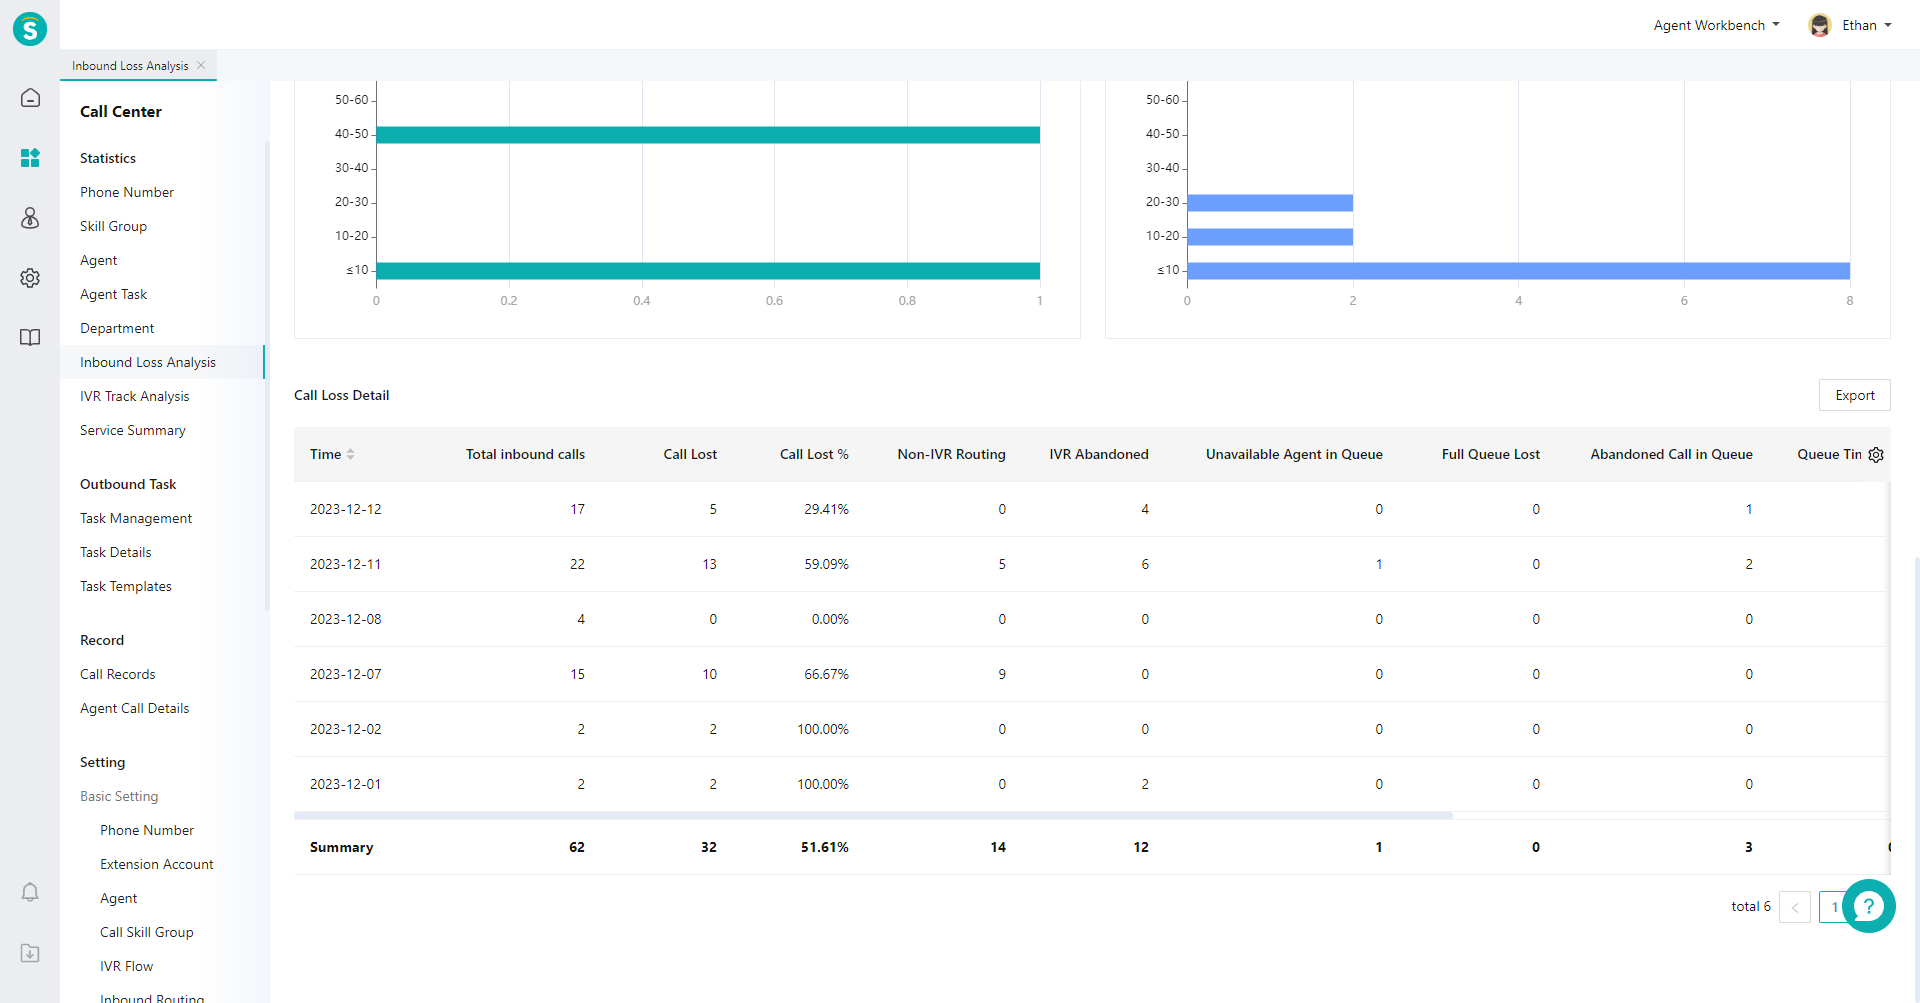
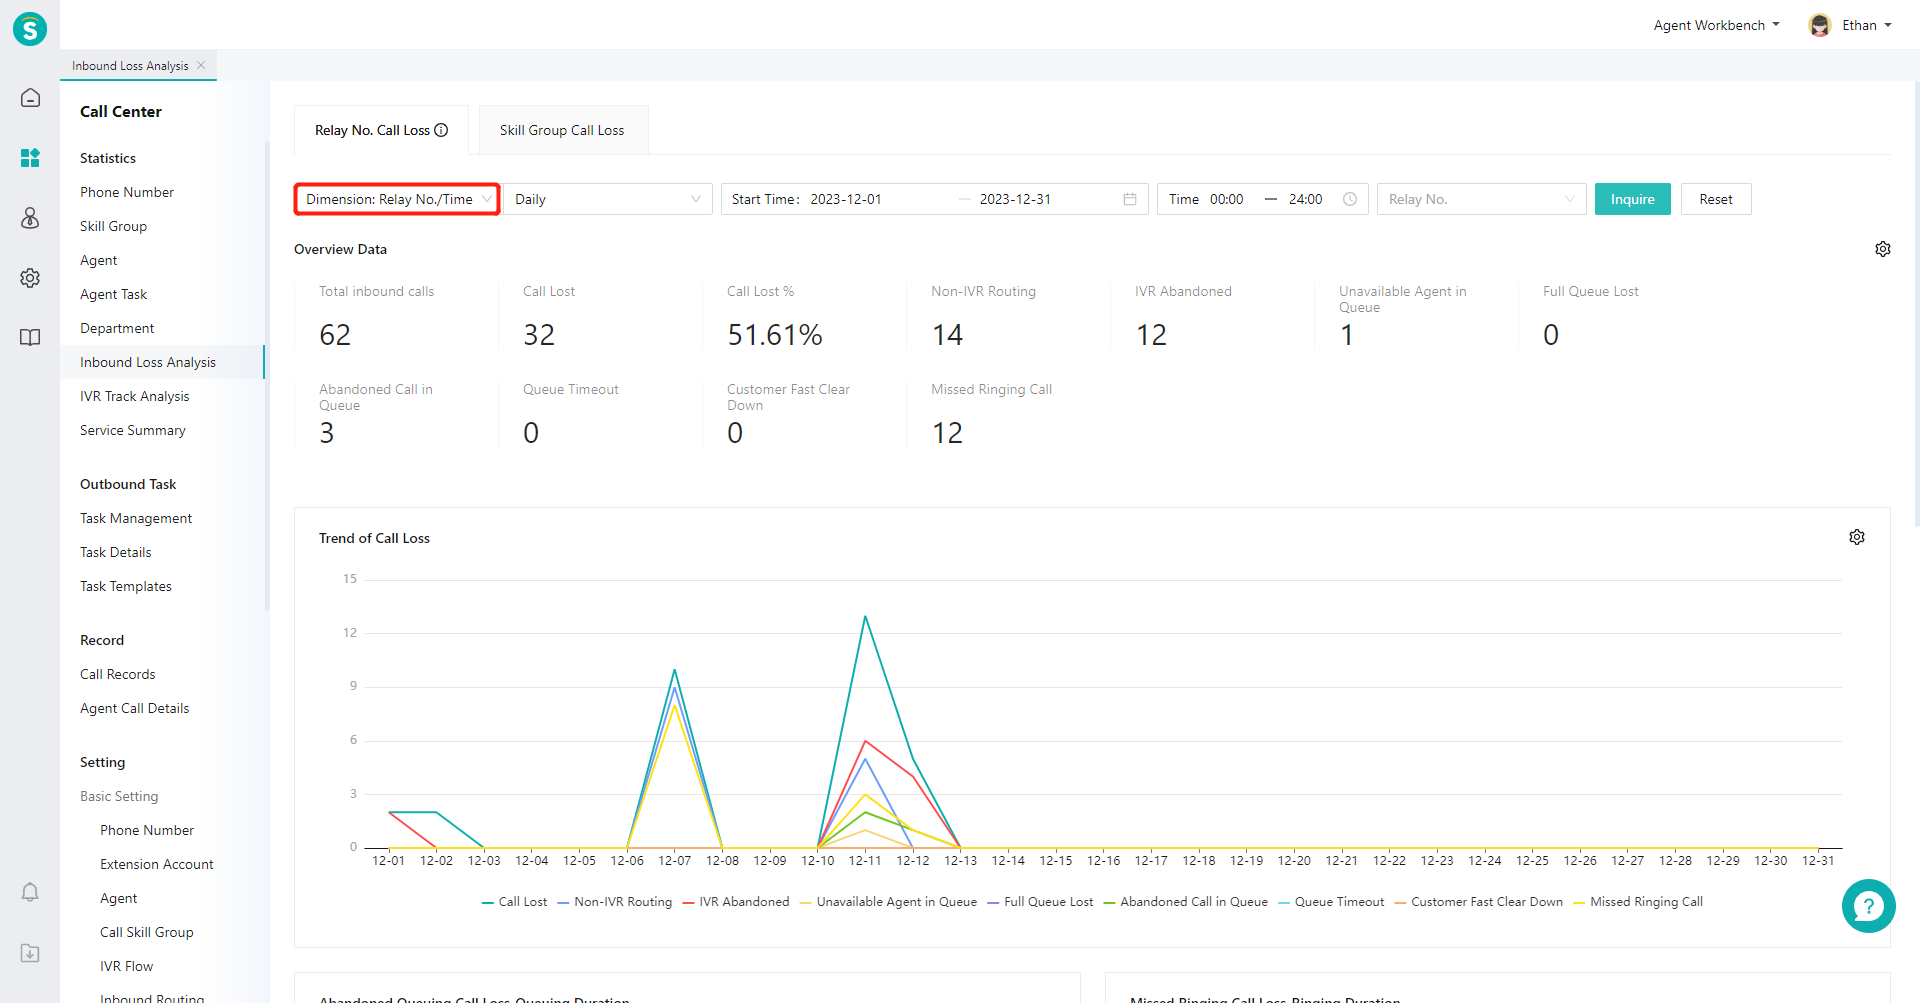
- Summary by time: in the top filter item, select "Time" as the dimension and "Daily Report" as the time type, and then click【Query】(Figure 1). View the daily summary data in the list (Figure 2).
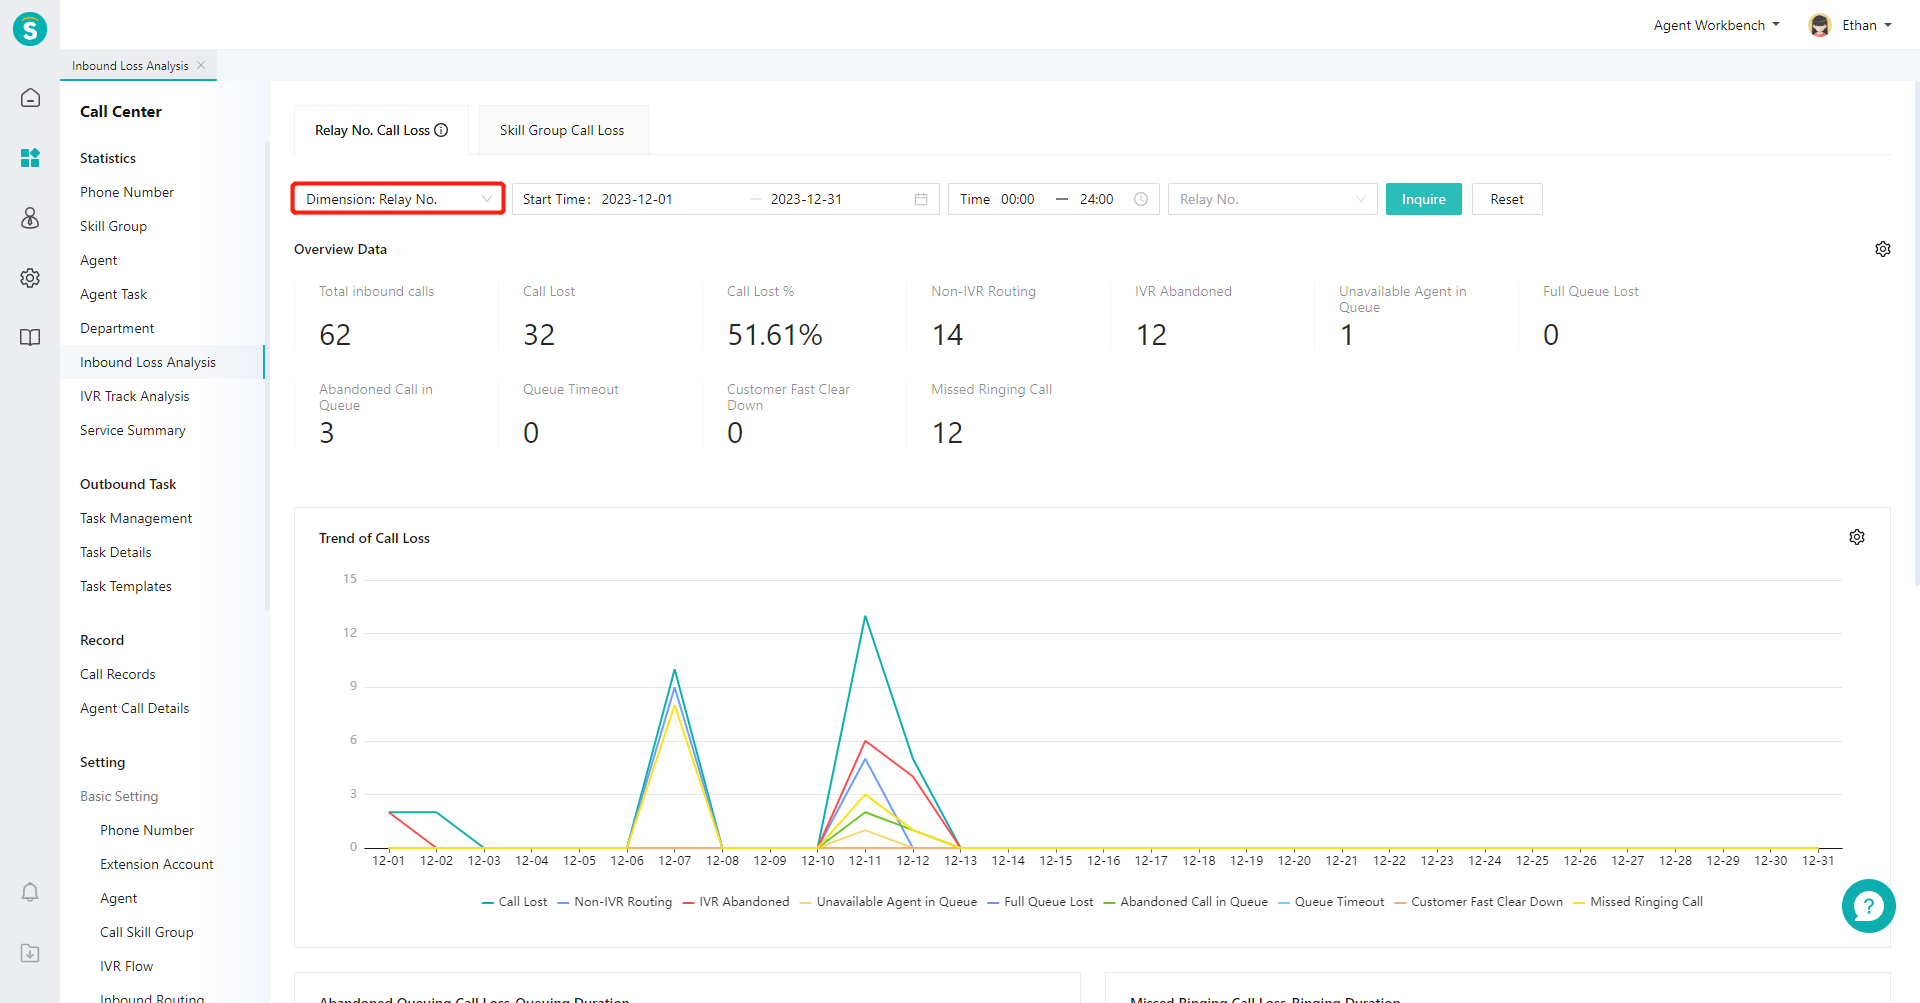
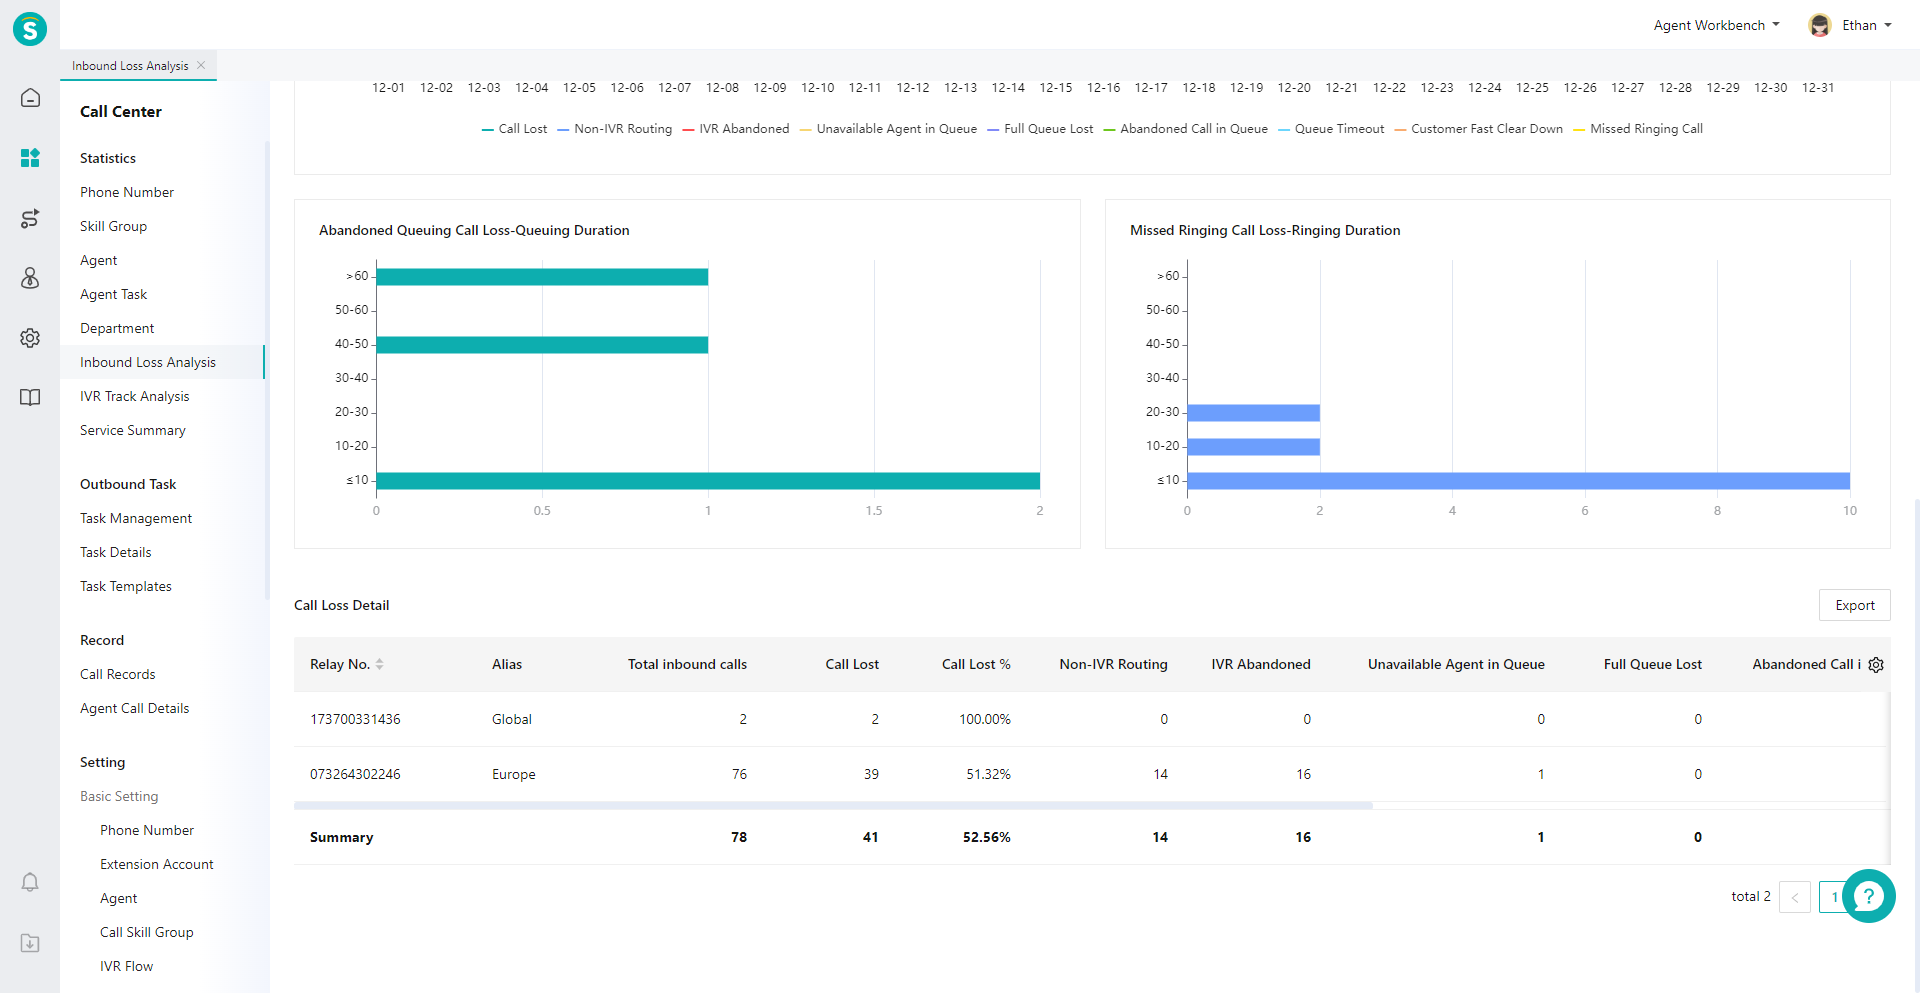
- Summary by relay number: in the top filter item, select「Relay number」as the dimension, and then click【Query】(Figure 3). View the summary data of each relay number in the list (Figure 3);
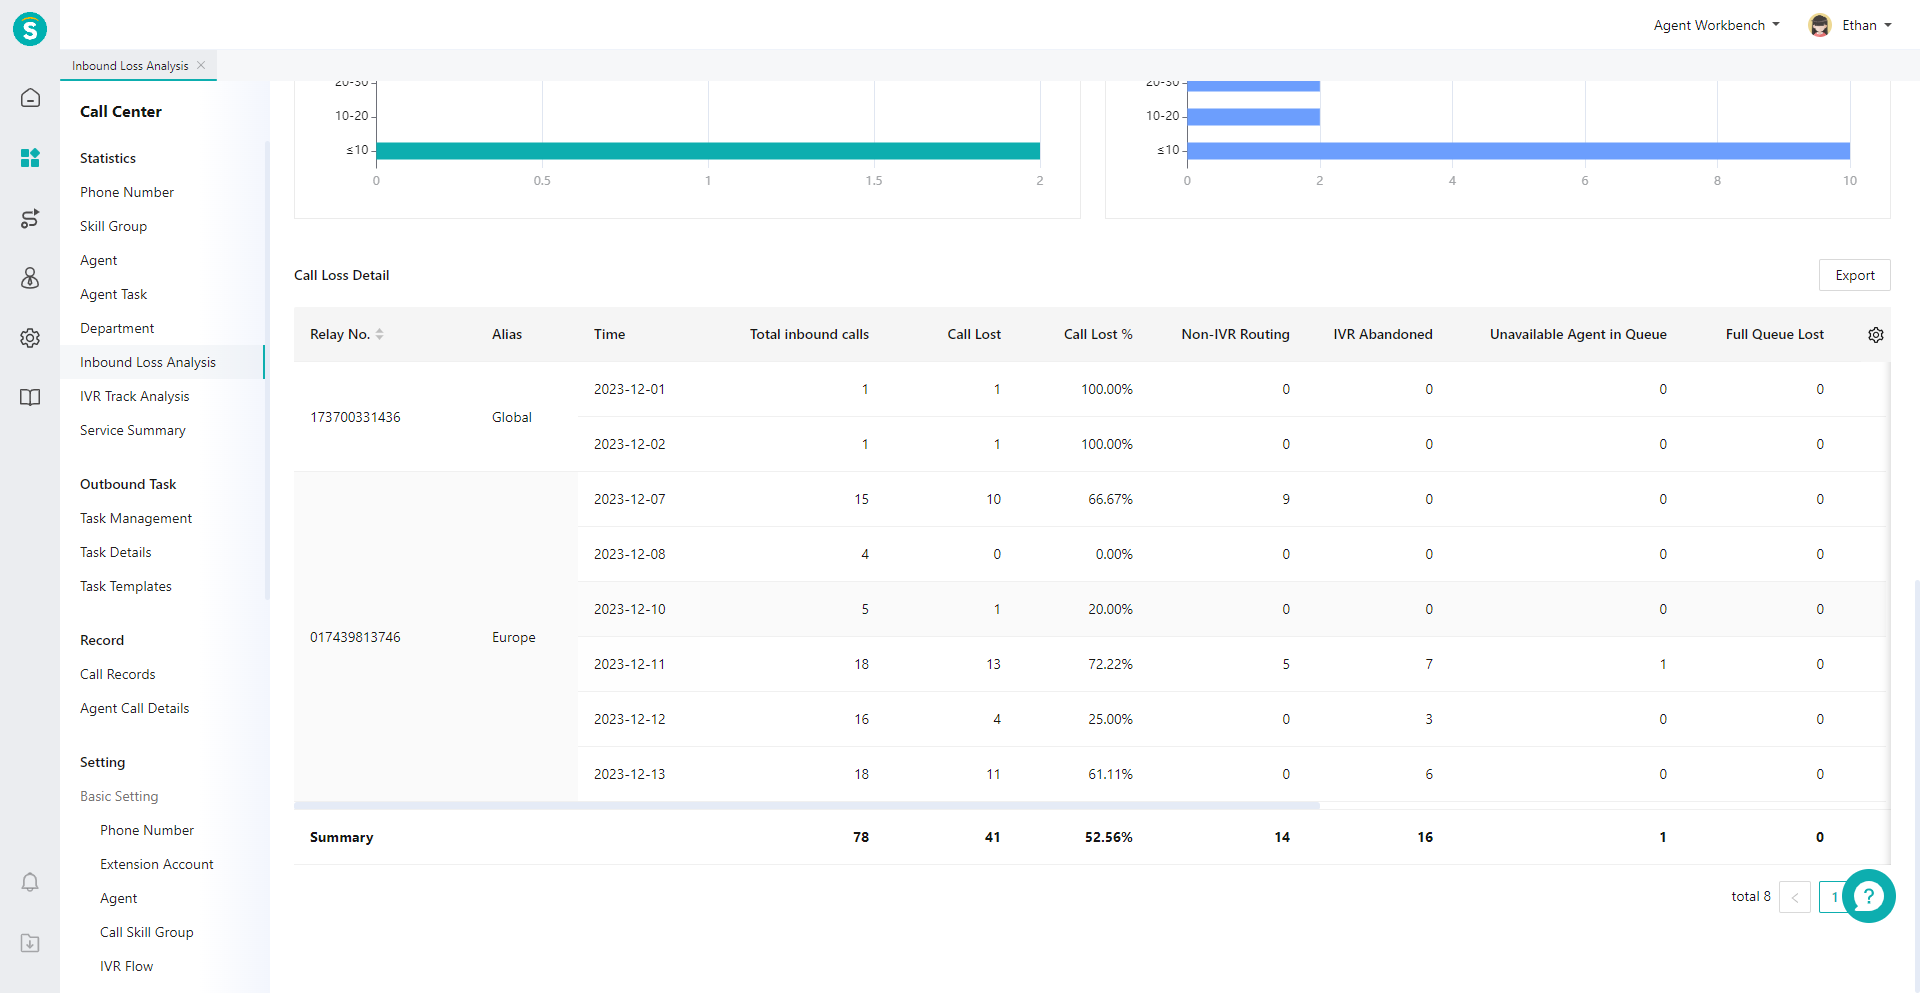
- Summary by relay number + time: in the top filter item, select "Relay Number/Time" as the dimension and "Daily Report" as the time type, and then click【Query】(Figure 4). View the daily summary data of each relay number in the list (Figure 5);
# ● View Indicator Description
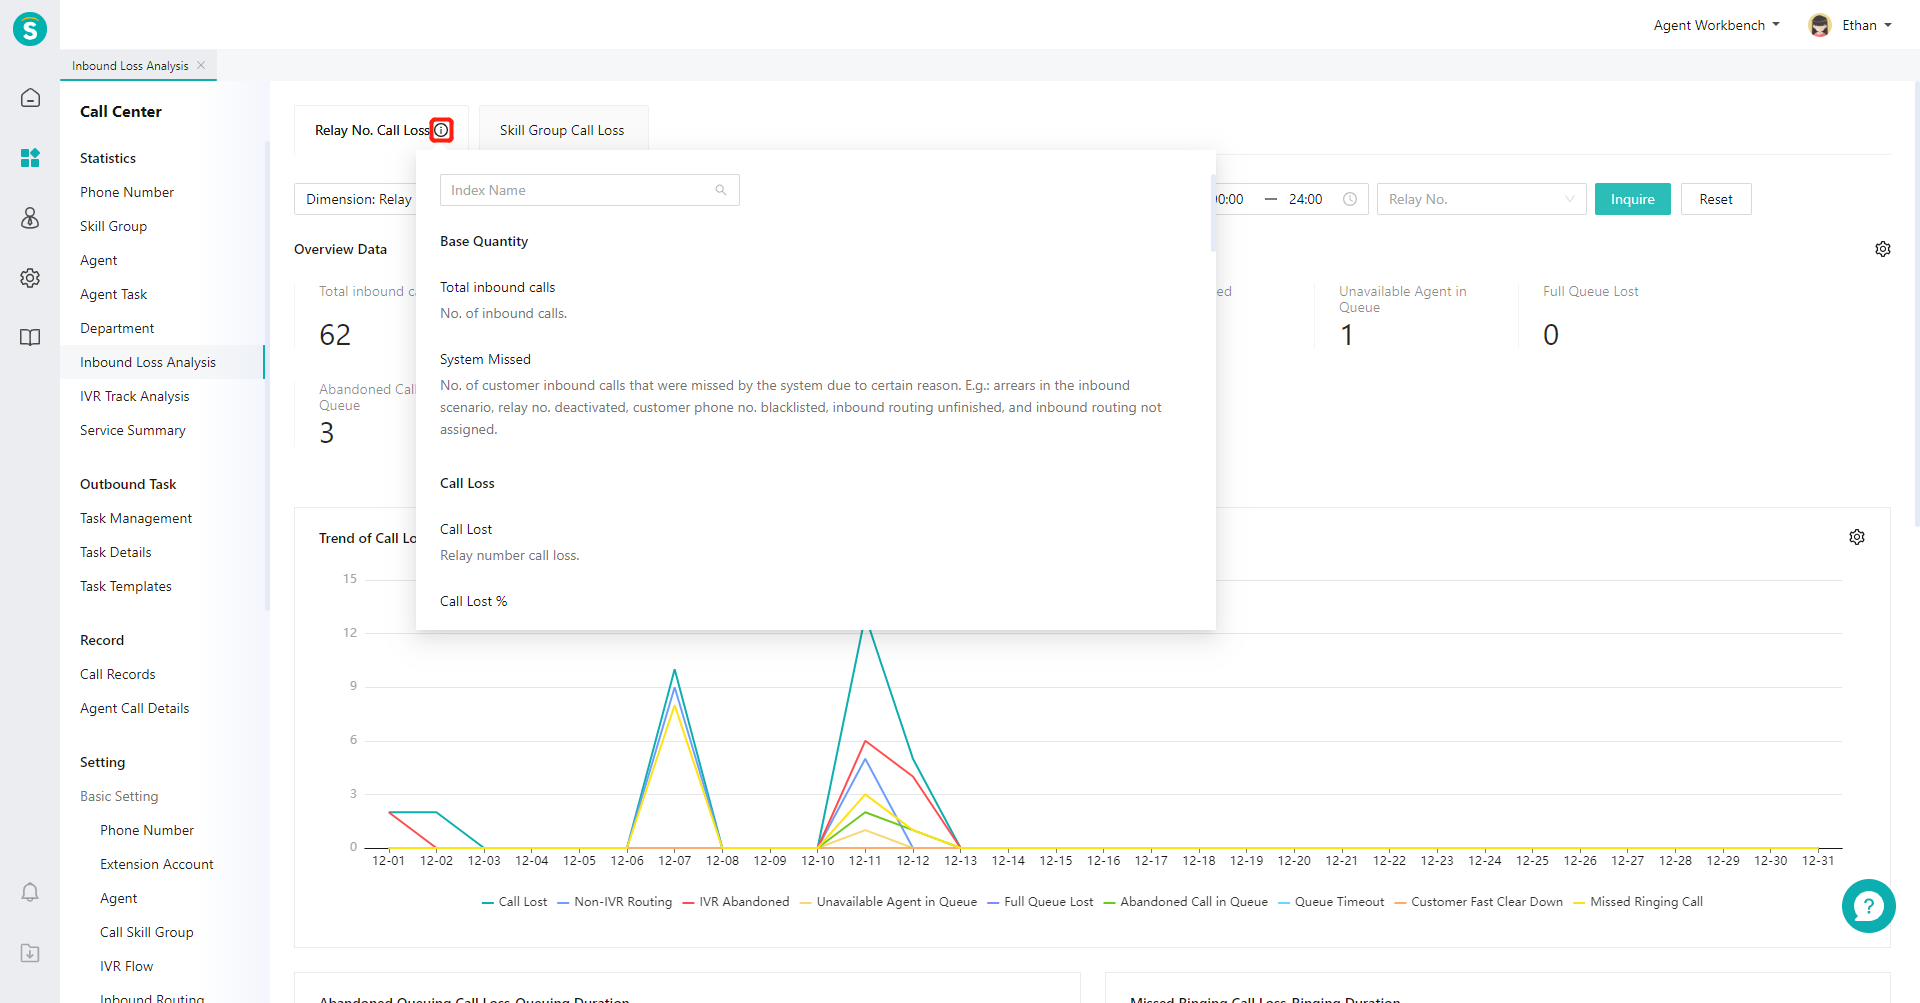
Move the mouse to the "Details" icon next to the page title and expand the indicator description bubble (Figure 7)
# ● Create Custom Indicator Scheme
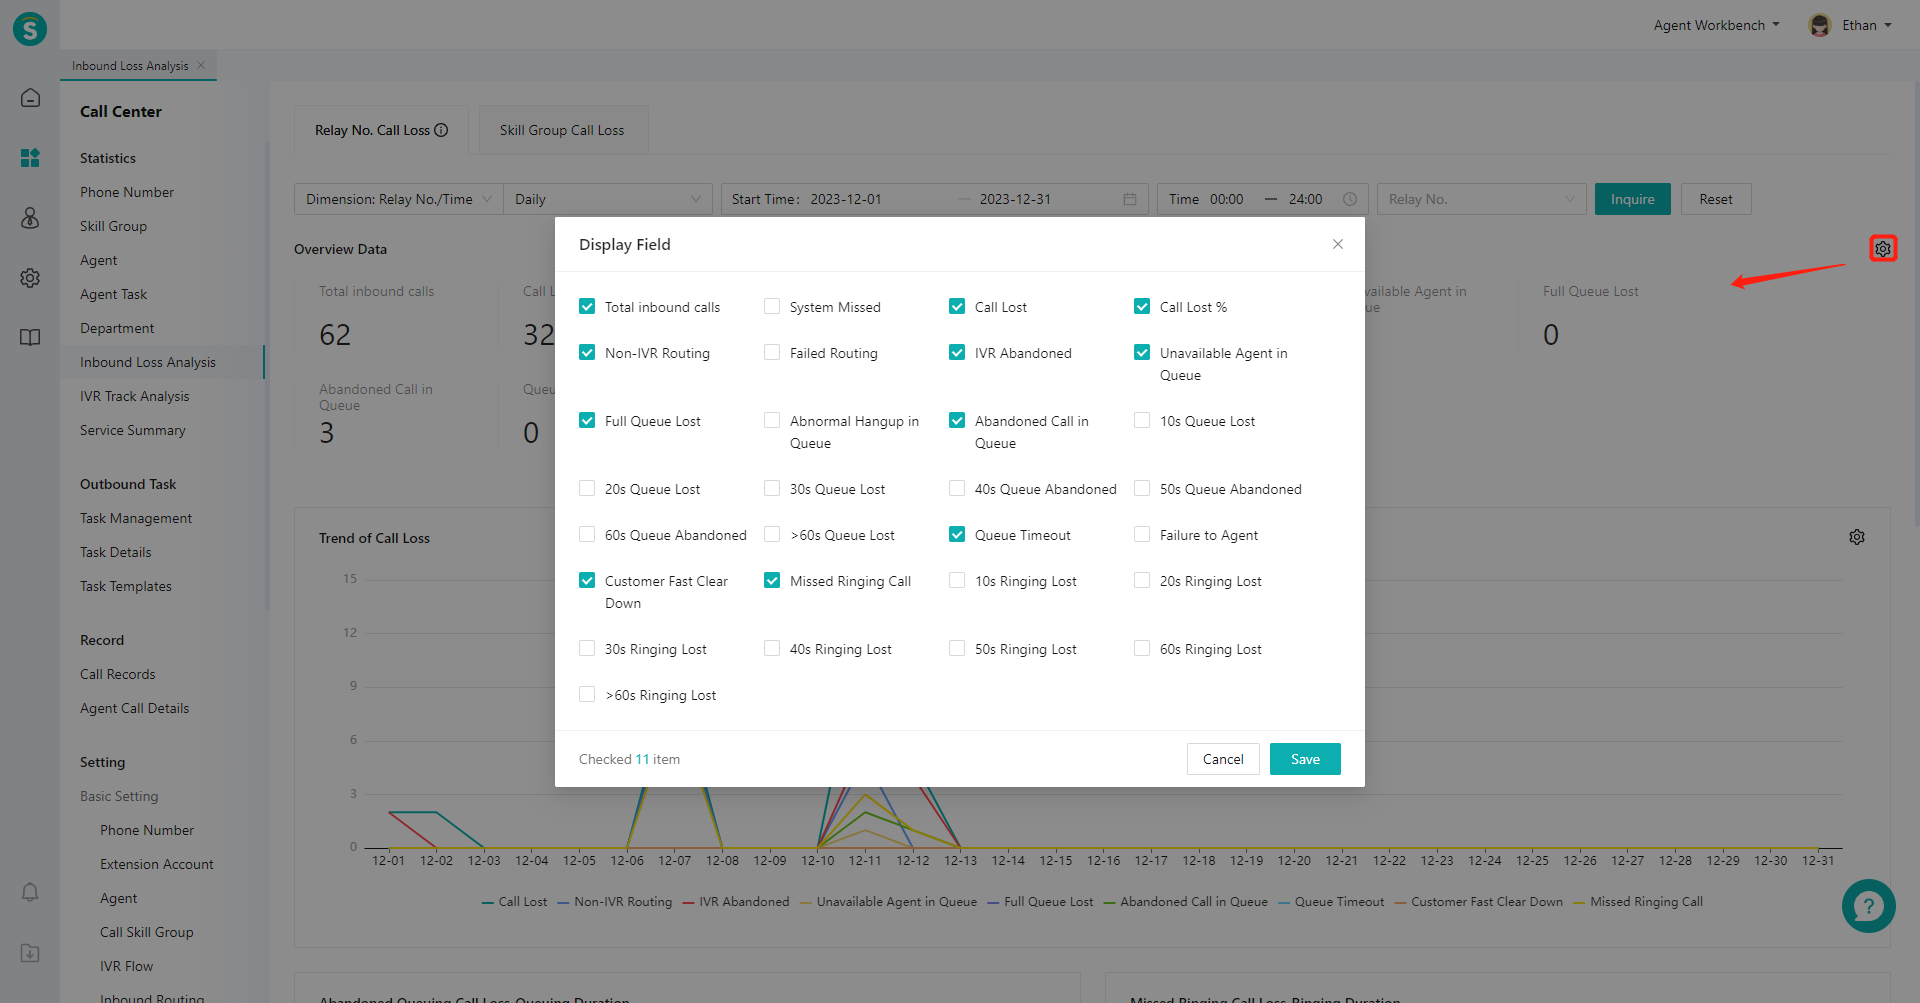
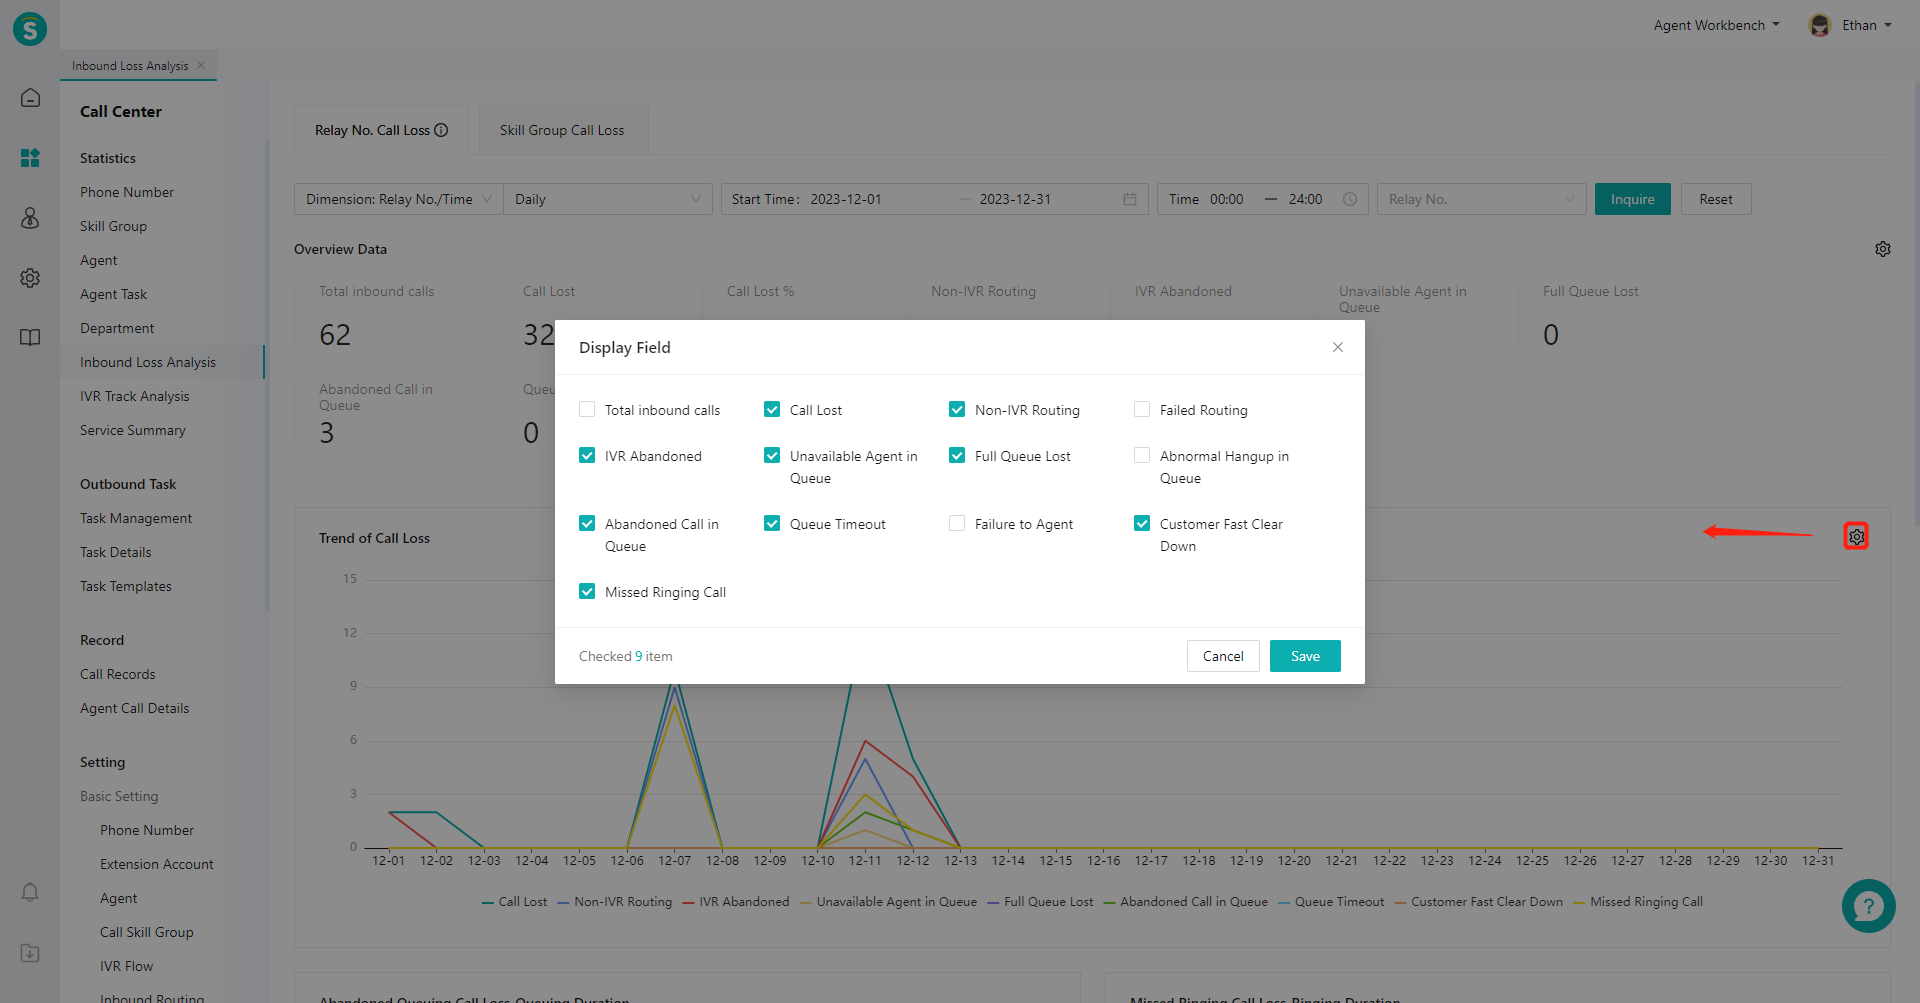
- Click the gear-shaped button on the right side of the overview area to expand the scheme list, and select the indicator display scheme in the pop-up window (Figure 8)
- Click the gear-shaped button on the right side of the chart area, and select the indicator display scheme in the pop-up window (Figure 9).
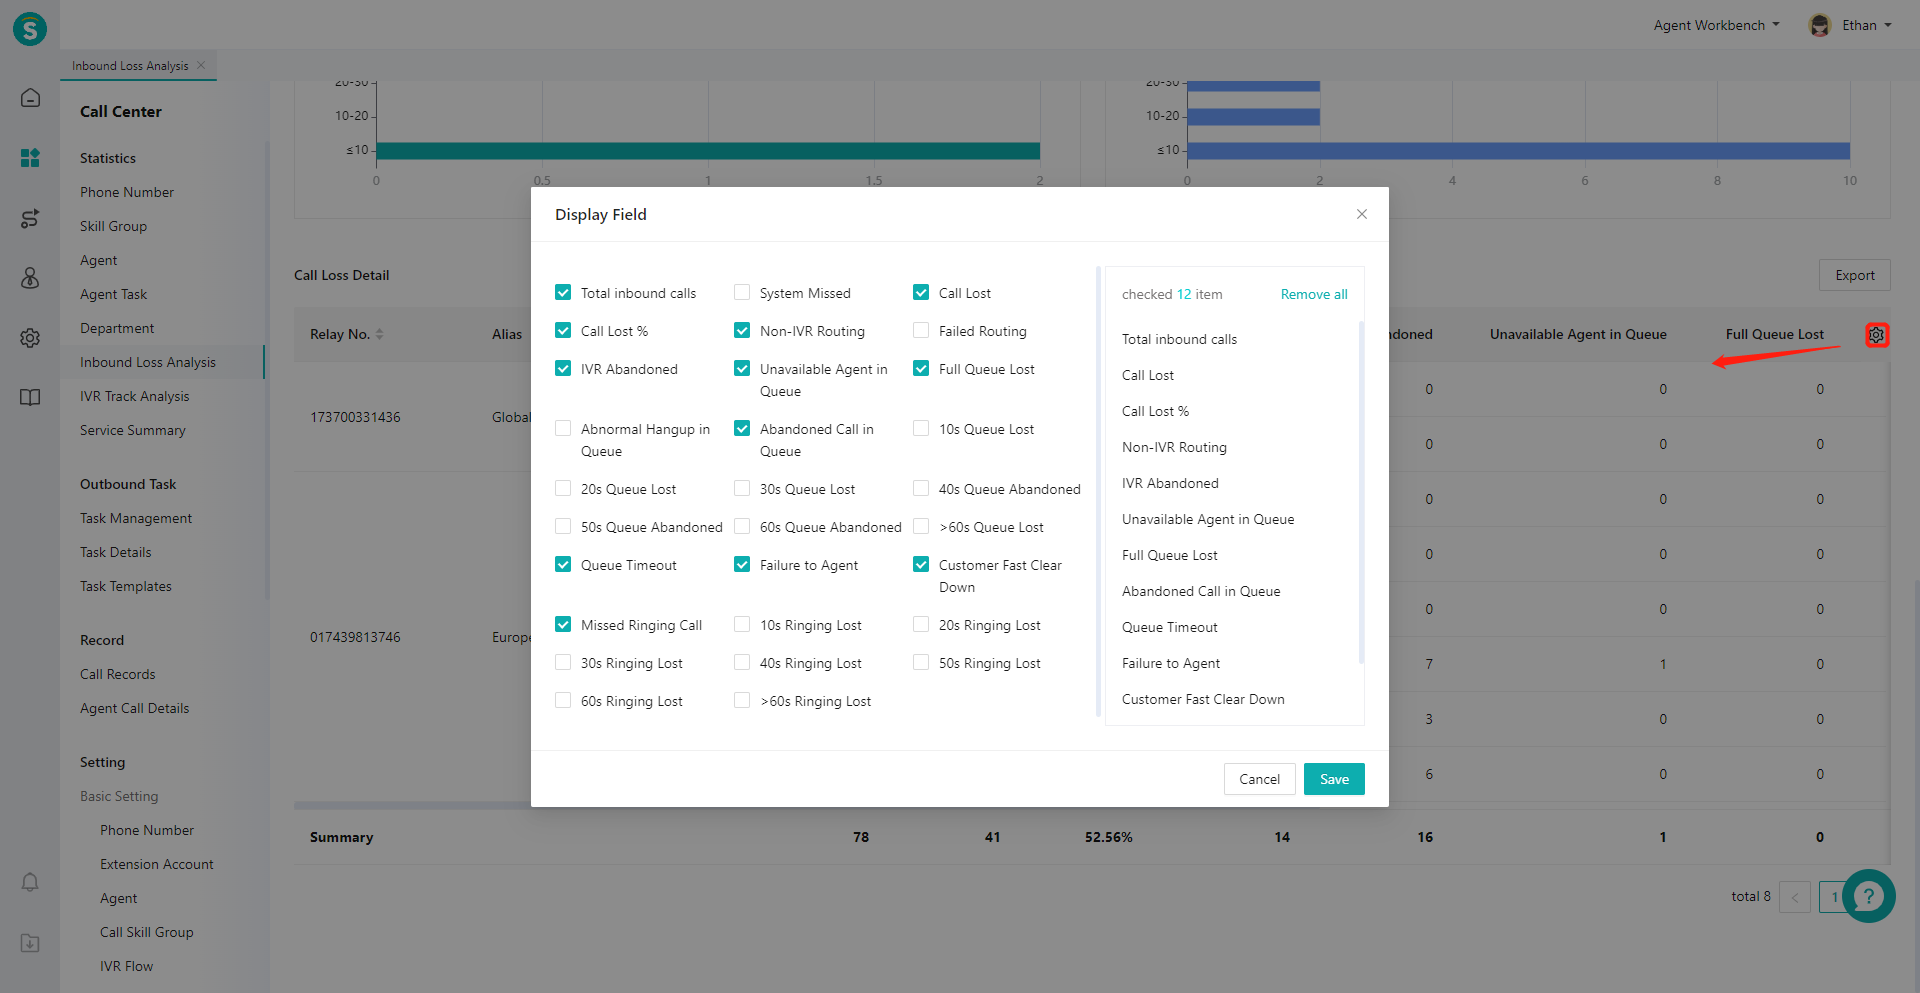
- Click the gear-shaped button on the right side of the list, and select the indicator display scheme in the pop-up window (Figure 10).
Last Updated: 11/18/2024, 7:17:07 PM