Product Documentation Product Documentation
Developer Documentation (opens new window)
  • Call Center Overview

  • Admin Console

    • Phone Number Report Guide
    • Skill Group Report Guide
    • Agent Report Guide
    • Agent Task Report Guide
    • Department Report Guide
    • Report Custom Kanban Guide
    • Inbound Loss Analysis Guide
    • IVR Track Analysis Guide
      • Service Summary Report Guide
      • Task Management Guide
      • Task Details Guide
      • Task Templates Guide
      • Call Records Guide
      • Agent Call Details
      • Phone Number Module Guide
      • Extension Account Module Guide
      • Agent Setting Guide
      • Call Skill Group Module Guide
      • IVR Flow Guide
      • Inbound Routing Guide
      • Outbound Routing Guide
      • Call Function Setting Guide
      • Satisfaction Template Guide
      • Call Trigger Guide
      • Forbidden Number Module Guide
      • AI Assistance User Guide
      • Calculation Rule Guide
      • Audio Management Guide
      • Business Hours Guide
      • Region Groups Guide
      • Agent Status Log Guide
      • Communication Network Log User's Guide
      • Docking Page Module Guide
      • Message Push Guide
    • Agent Workbench

    • Other descriptions

    • Call Center
    • Admin Console
    Sobot
    2023-02-22
    Menus

    IVR Track Analysis Guide

    # IVR Track Analysis Guide

    ——Learn how to view the number of calls at each node in the IVR flow and the number of inflow and outflow at each node through this article.

    # Role of IVR Track Analysis

    IVR Track Analysis completes statistics on user flow data in the IVR flow. By mining and analyzing user path and button selection data, it can help enterprises analyze customer behavior patterns towards IVR, obtain the operational efficiency of IVR in actual business scenarios, and help enterprises analyze existing IVR configuration issues while obtaining business data, and continuously improve IVR.

    # Main Functions of IVR Track Analysis

    # ● Indicator Query
    1. Support summarizing statistical indicator data by time.
    2. Support filtering statistical indicator data by time. (e.g., only query data of 09:00 - 18:00 every day).
    3. Support summarizing statistical indicator data by relay number.
    4. Support querying call data at different nodes in different IVR flows (display statistical indicator values of different IVR flows and different nodes).
    5. Statistical indicators include inflow, outflow, answer, staying time, and trans-to-agent calls and times and other indicators.
    # ● Visual Chart
    1. Support viewing statistical indicator data in the form of visual chart.
    2. Support freely dragging nodes and adjusting interface layout by one-click auto-placement.

    # How to Use IVR Track Analysis

    # ● Query Statistical Data by Different Query Conditions
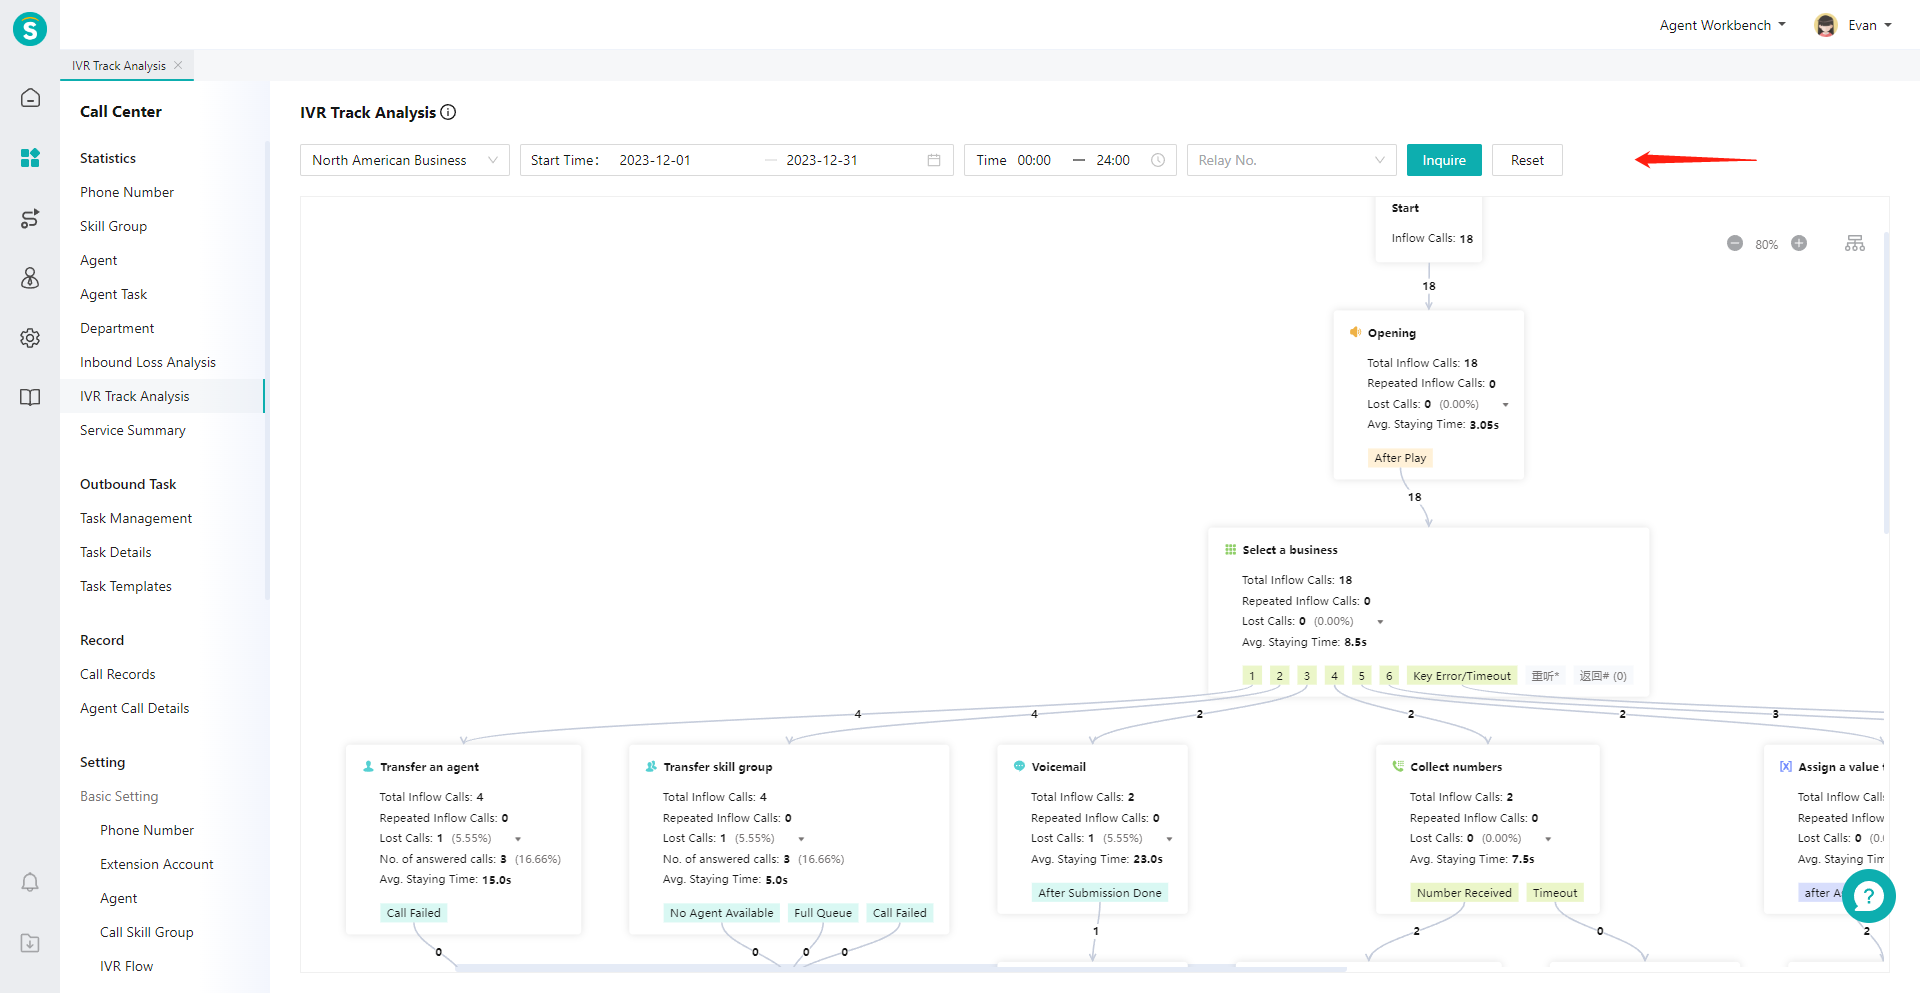
    1. Select the IVR flow and time range conditions to query in the top filter conditions, and click [Query](Figure 1).
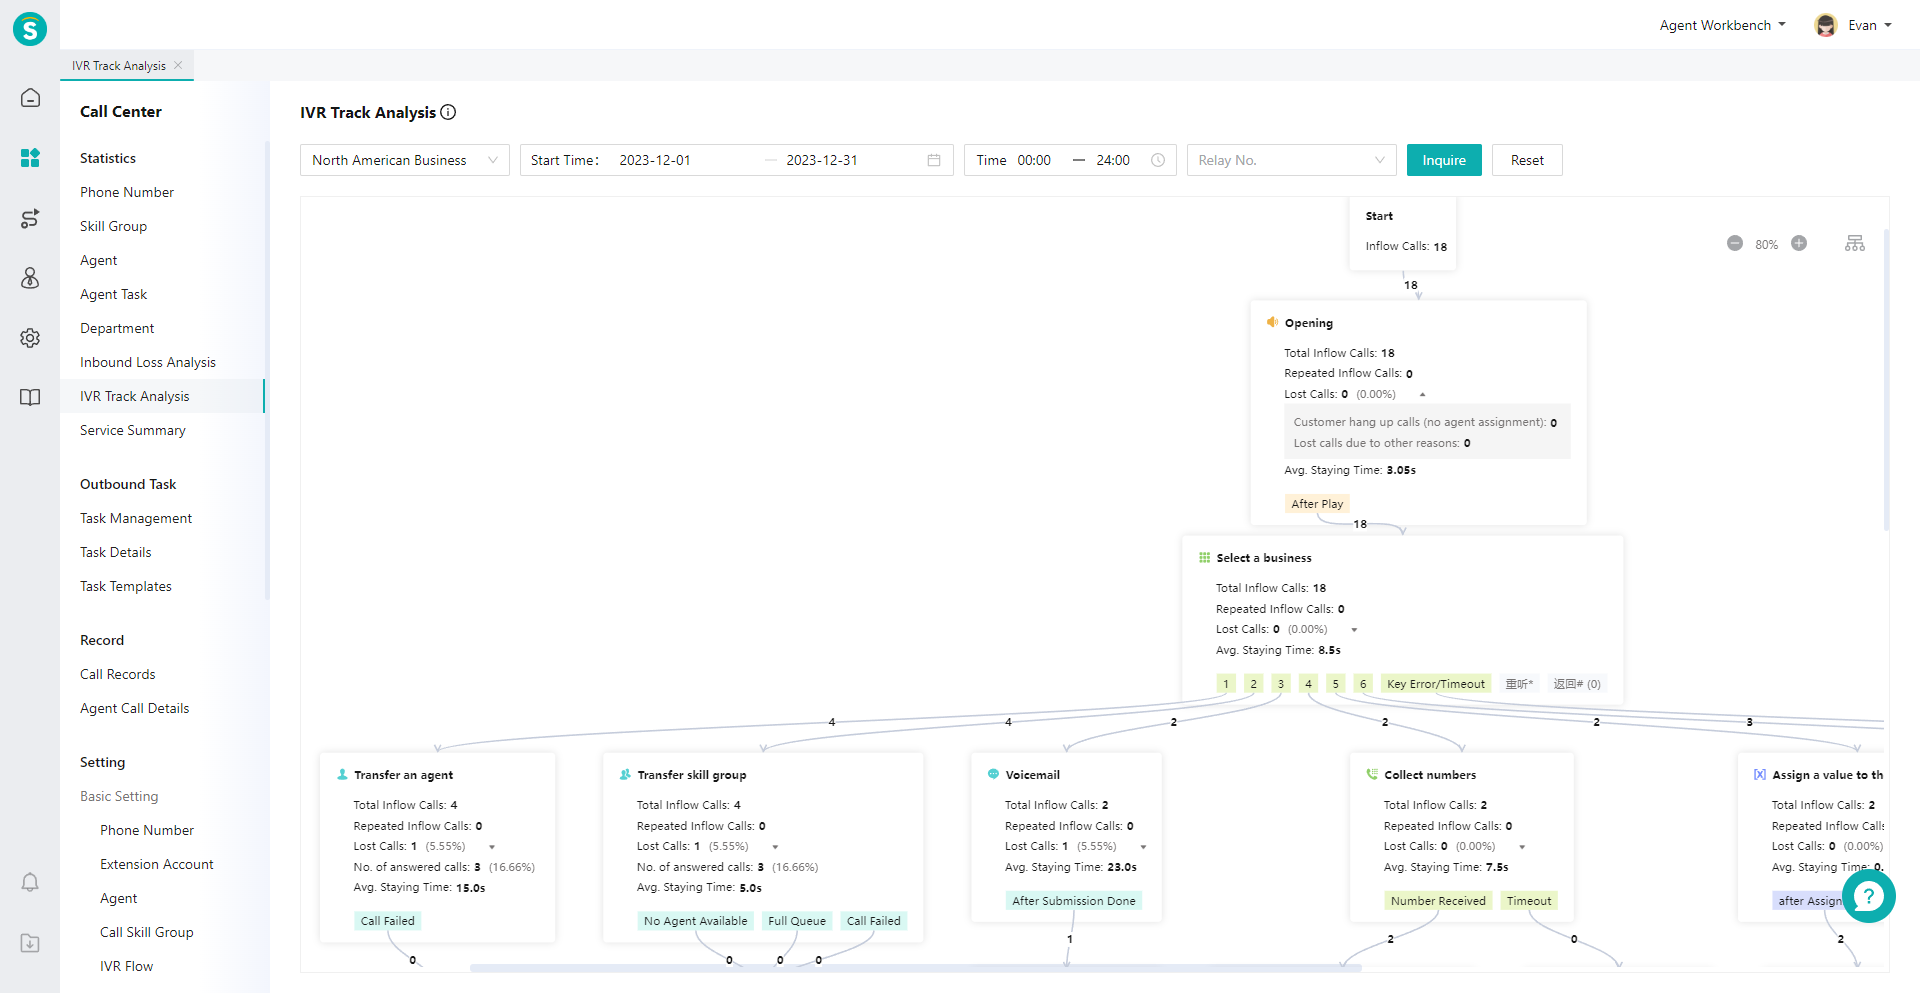
    2. In the following chart, view the call data statistics for each node in IVR, as well as the inflow and outflow number data for each node (Figure 2).

    01

    Figure 1: Select「Query」Condition

    02

    Figure 2: View IVR Flow Statistics

    # ● View Indicator Description

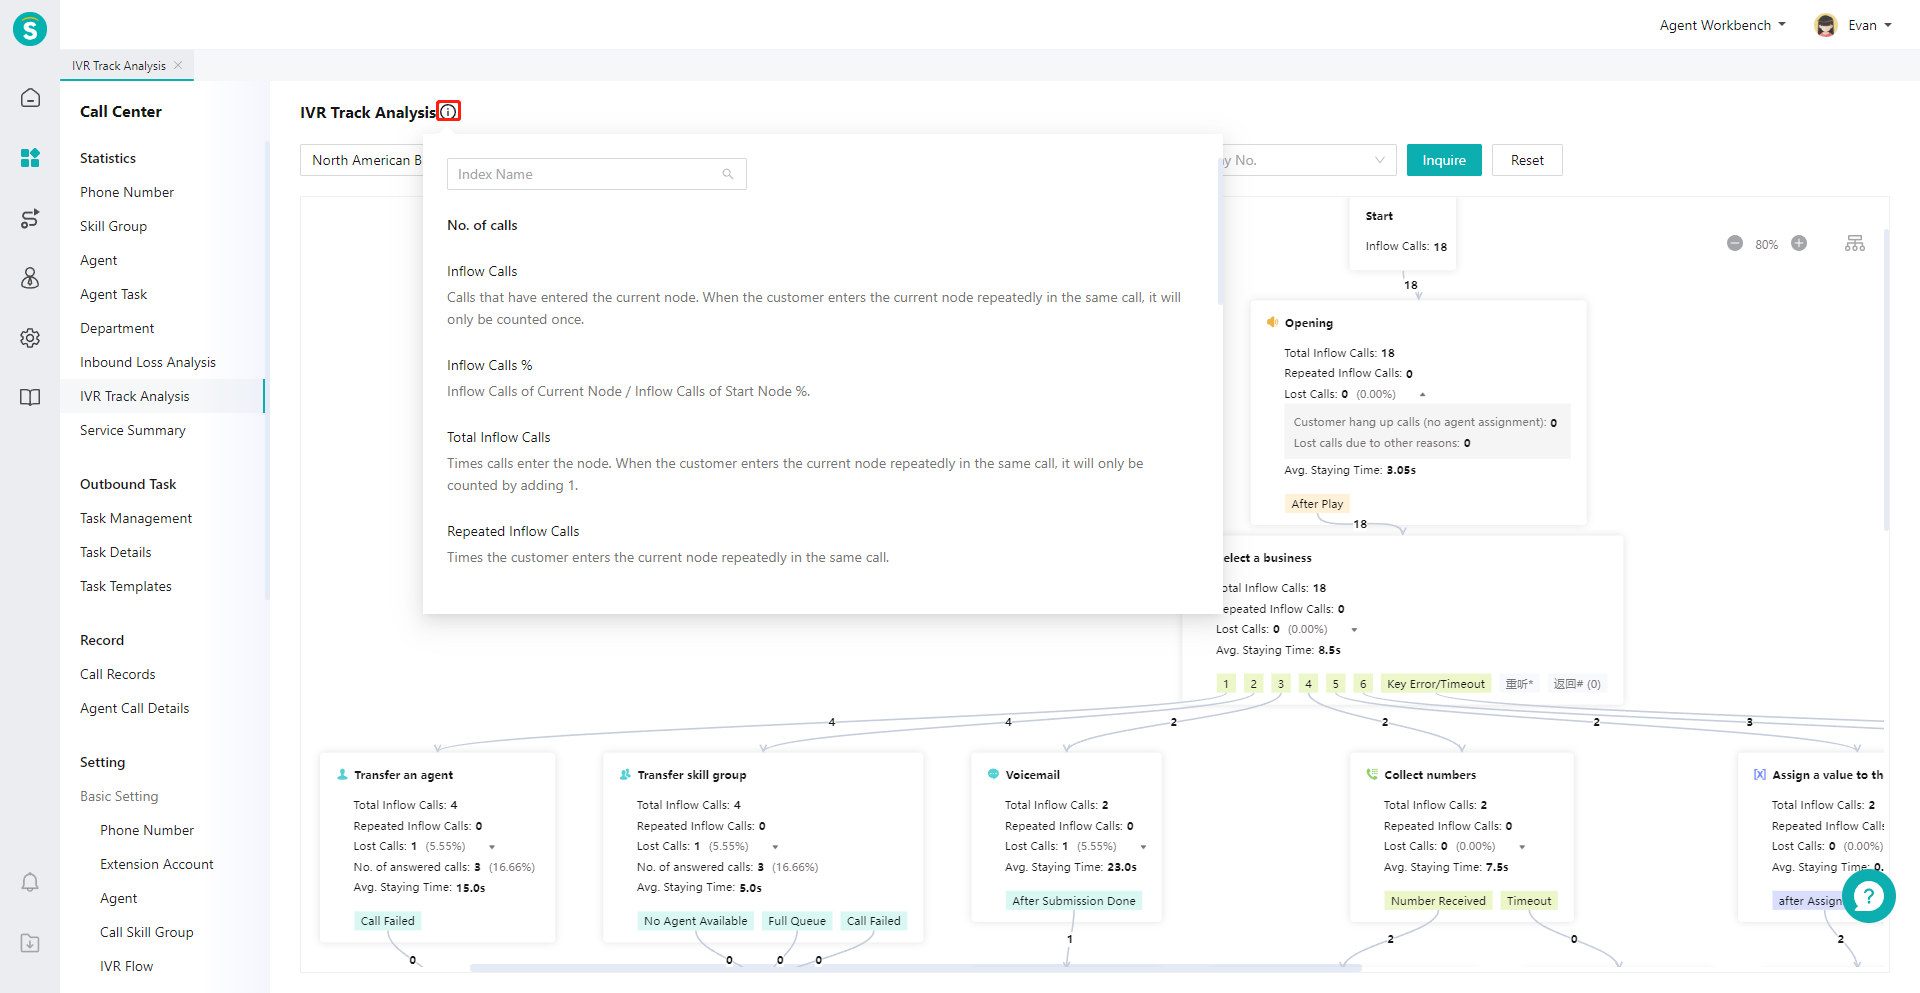
    Move the mouse to the "Details" icon next to the page title and expand the indicator description bubble (Figure 3)

    03

    Figure 3: View Indicator Description

    Last Updated: 11/18/2024, 7:17:07 PM

    ← Inbound Loss Analysis Guide Service Summary Report Guide→

    Update Date
    01
    AI Assistance User Guide
    02-26
    02
    Communication Network Log User's Guide
    02-26
    03
    SLA Guide
    01-25
    More Articles>
    Theme by Vdoing
    • Follow Sys
    • Line
    • Dark
    • Read