Skill Group Report Guide
# Skill Group Report Guide
——Learn how to query the statistical data of inbound indicators based on the skill group and time through this article.
# Main Functions of Skill Group Report
# ● Indicator Query
- Support summarizing statistical indicator data by time (such as by 0.5h, hour, day, week, and month).
- Support summarizing statistical data by skill group (display the indicator value of each skill group). For example: view the comparison of inbound skill groups of multiple skill groups.
- Support summarizing the statistical data by skill group and time (display the indicator values of each skill group summarized by 0.5h, hour, day, and month). For example: view the comparison of daily and monthly inbound skill groups of multiple skill groups.
- Support filtering statistical data by time node (e.g., only query data of 09:00 - 18:00 every day).
# ● Customize Indicator Display Scheme
- Support users to customize a set of overview area indicator display scheme.
- Support users to customize multiple sets of list indicator display schemes according to different scenarios. For example: create a set of "answer % indicator display scheme" and a set of "call loss indicator display scheme".
# ● Custom Kanban
Support users to create custom graphic kanban. Kanban supports bar chart, line chart, report and other forms, facilitating users to analyze data according to the Kanban of different businesses. For detailed function introduction, please view: Report Custom Kanban Guide
# How to Use Skill Group Report
# ● View Indicators by Summaries of Different Dimensions
Support viewing indicators by summaries by time, skill group, time + skill group, and skill group + time.
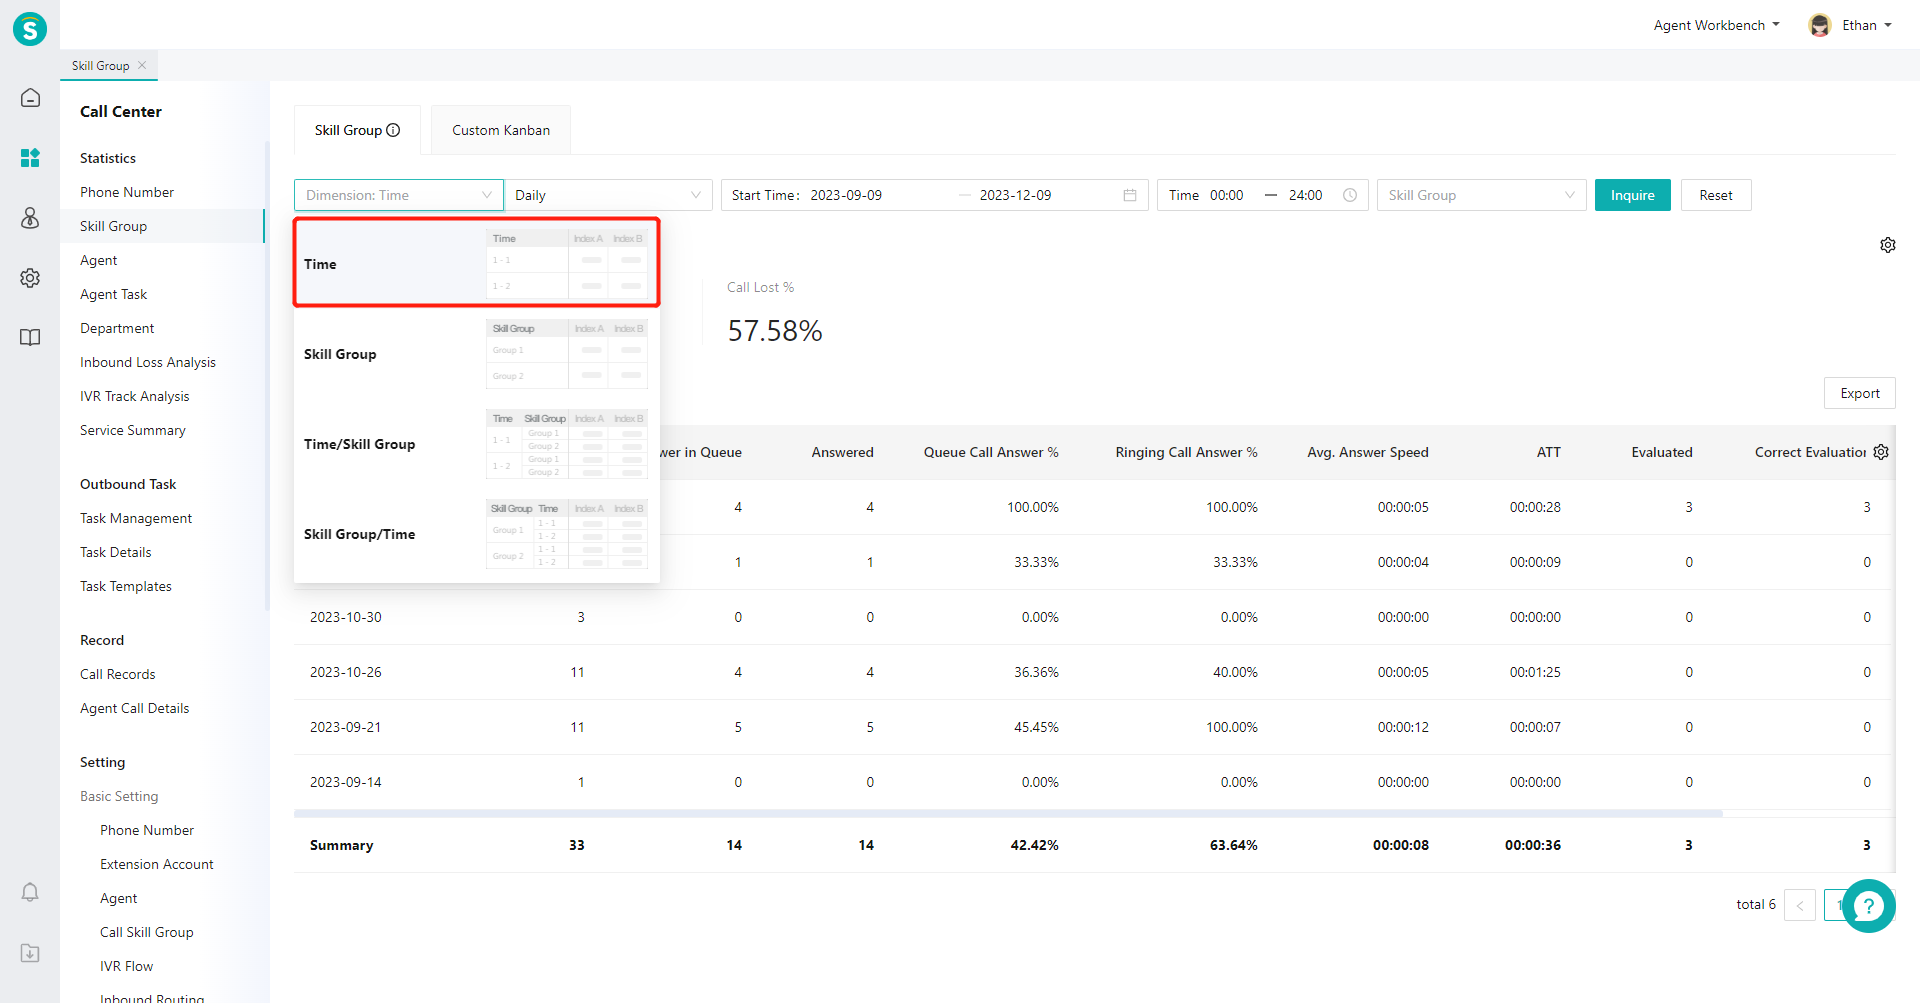
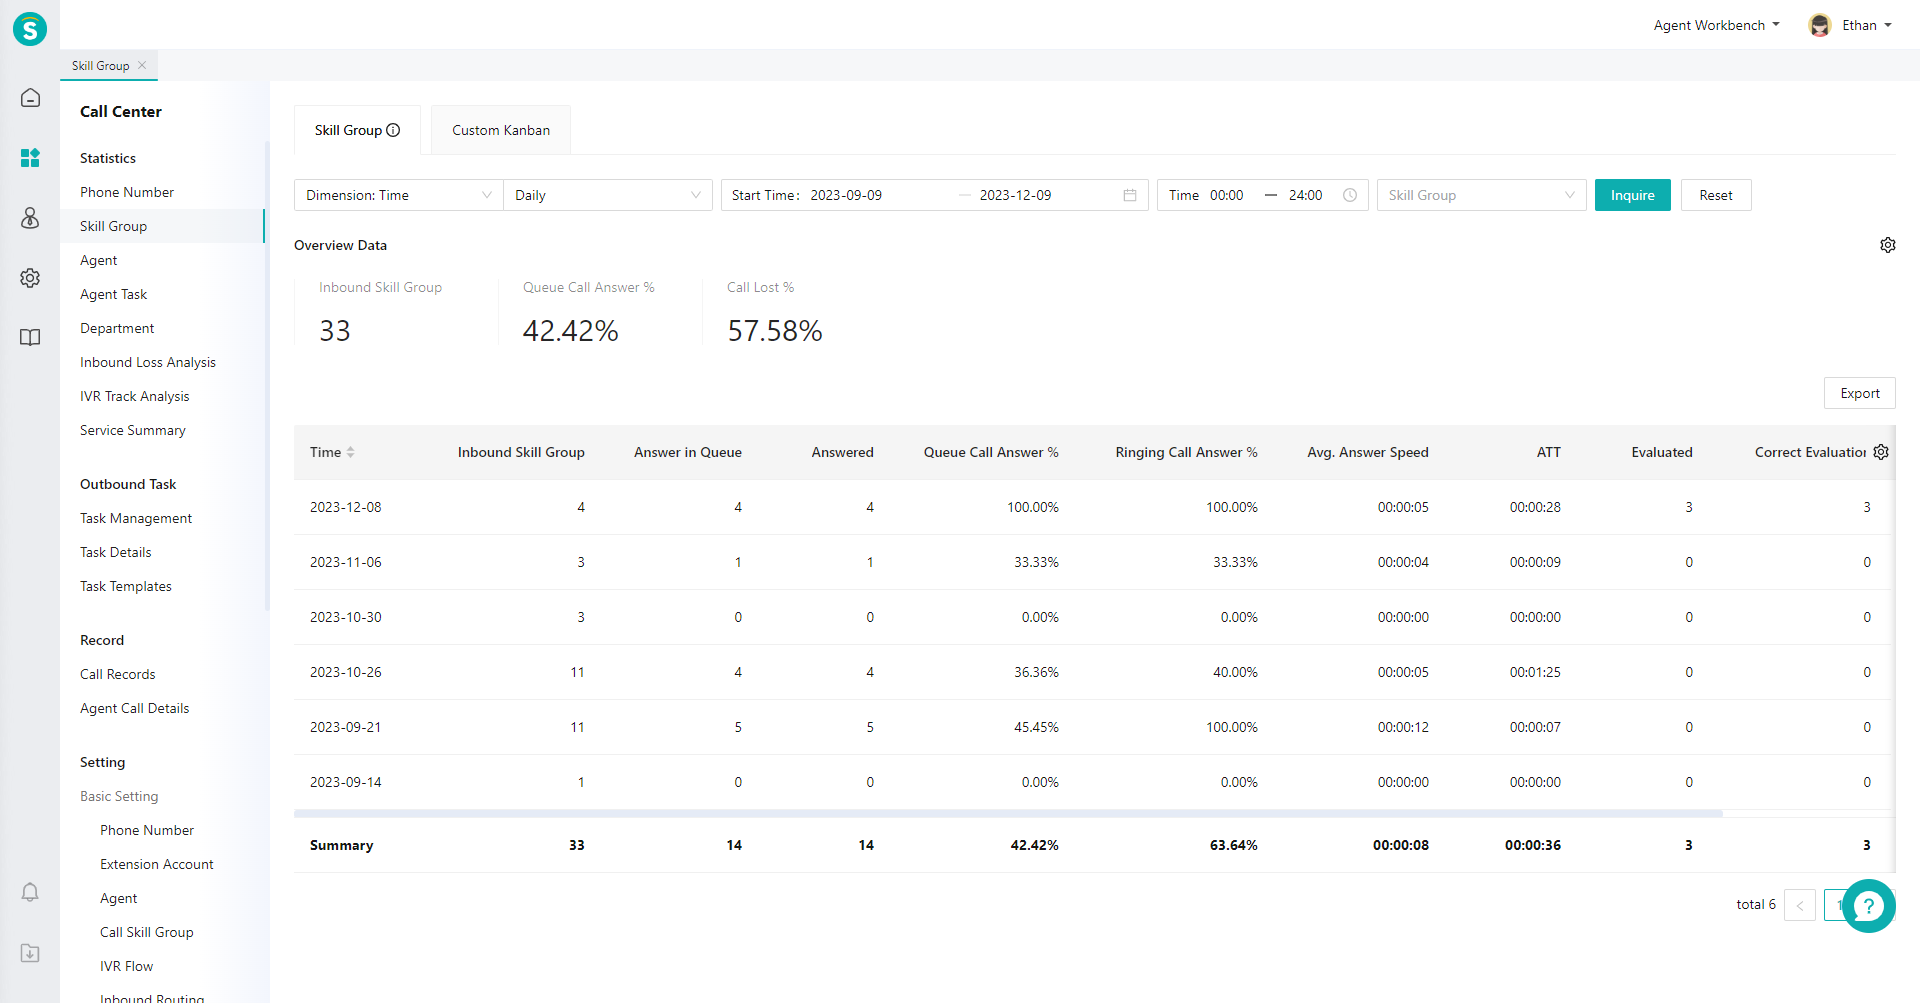
- Summary by time: In the top filter item, select "Time" for dimension and "Daily Report" for time type, and then click【Query】(Figure 1). View the daily summary data in the list (Figure 2).
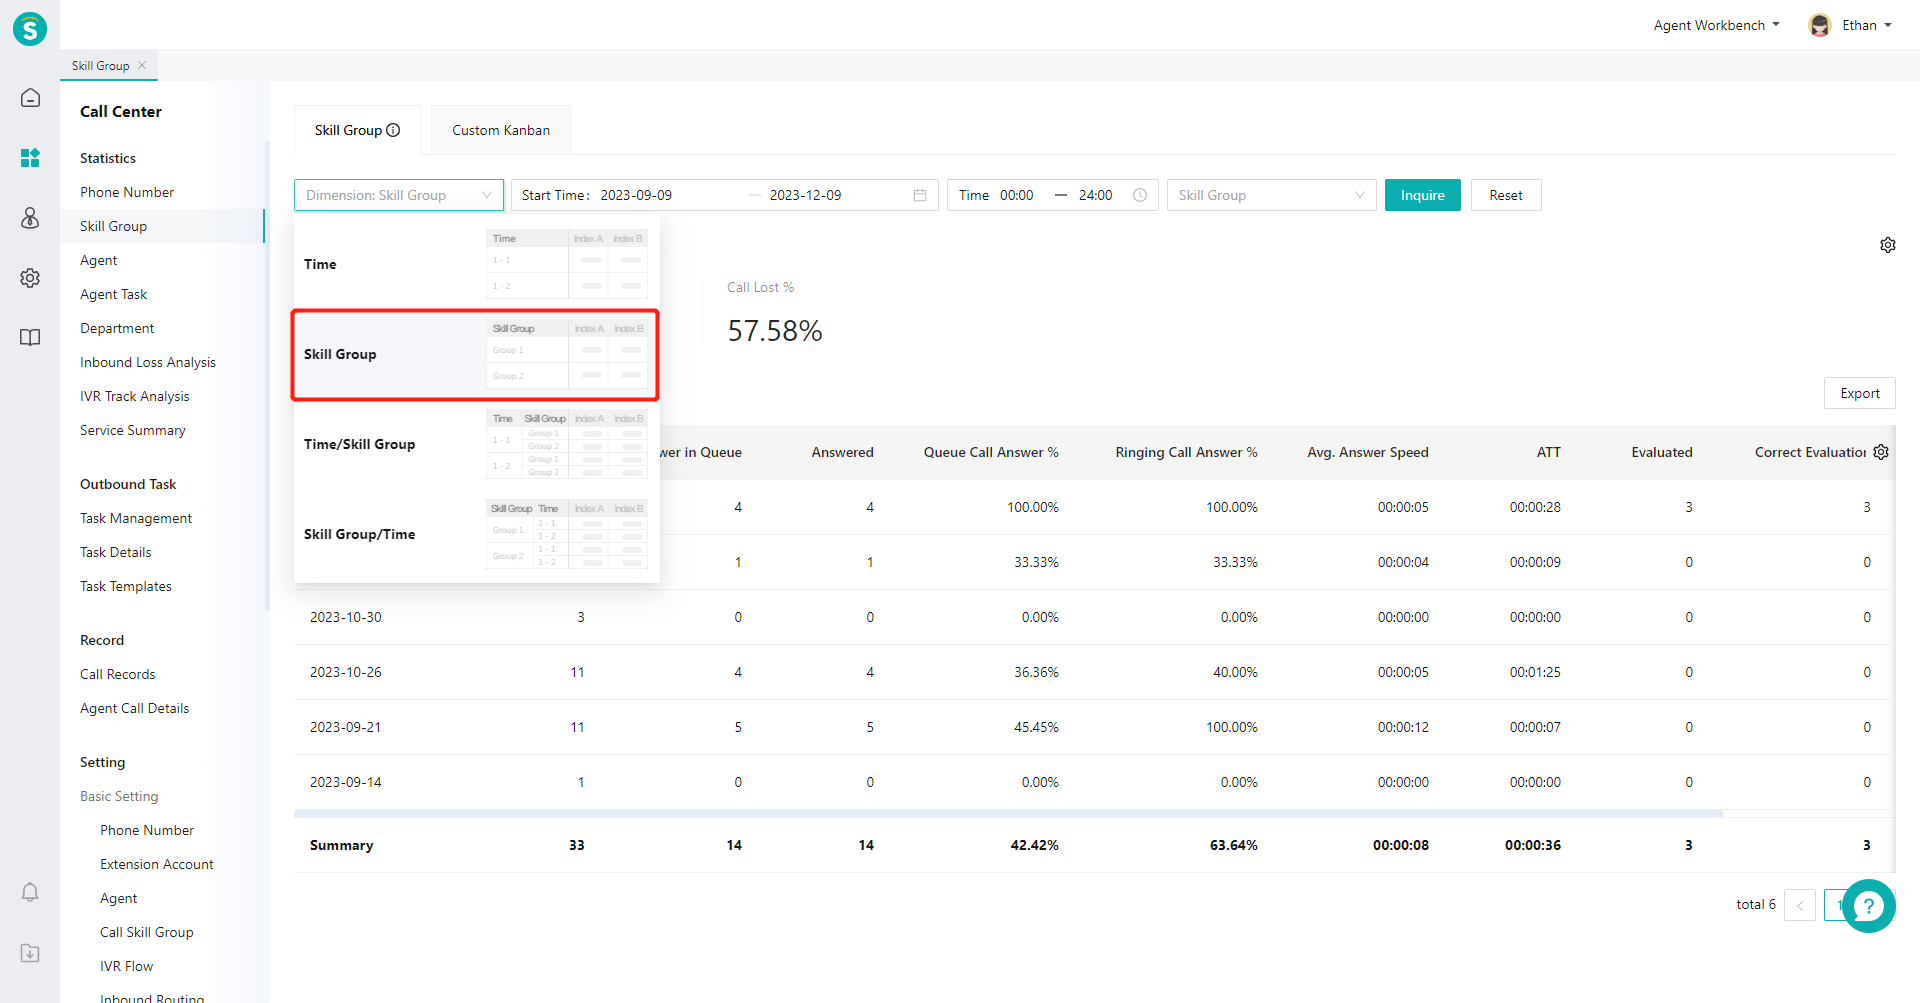
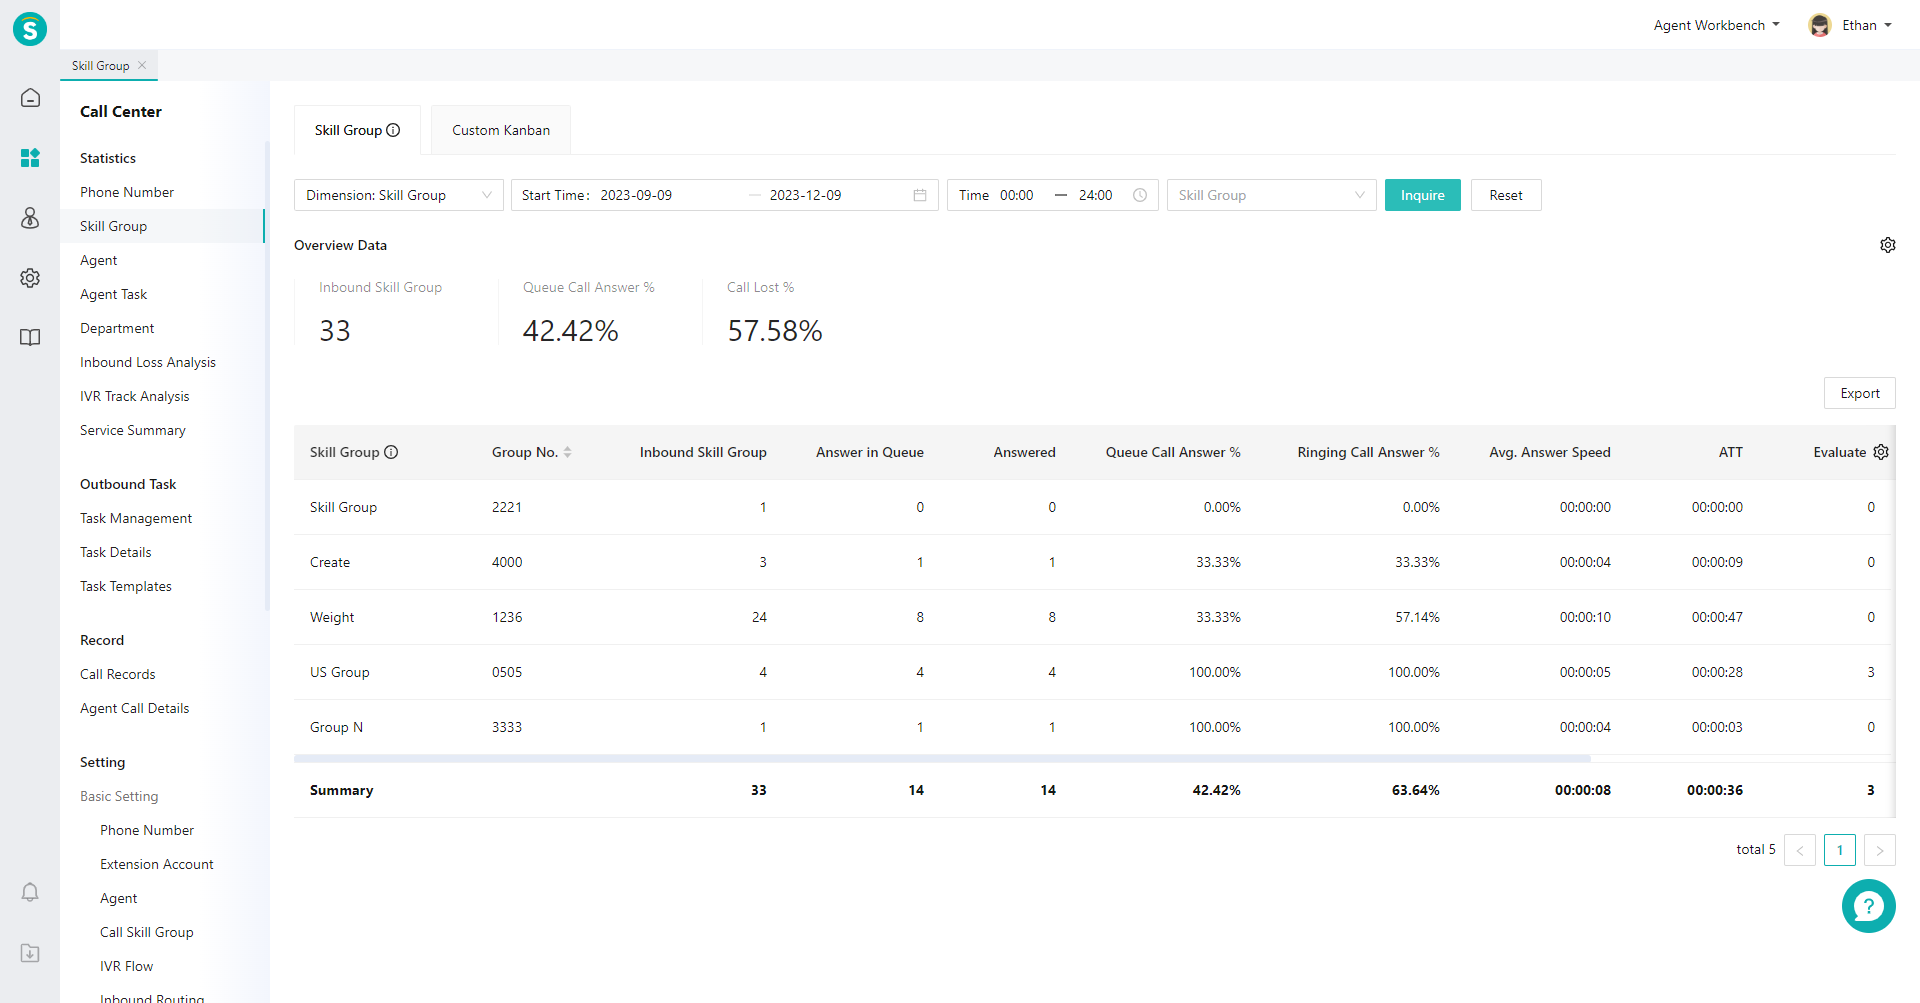
- Summary by skill group: In the top filter item, select「Skill Group」for the dimension, and then click【Query】(Figure 3). View the summary data of each skill group in the list (Figure 4).
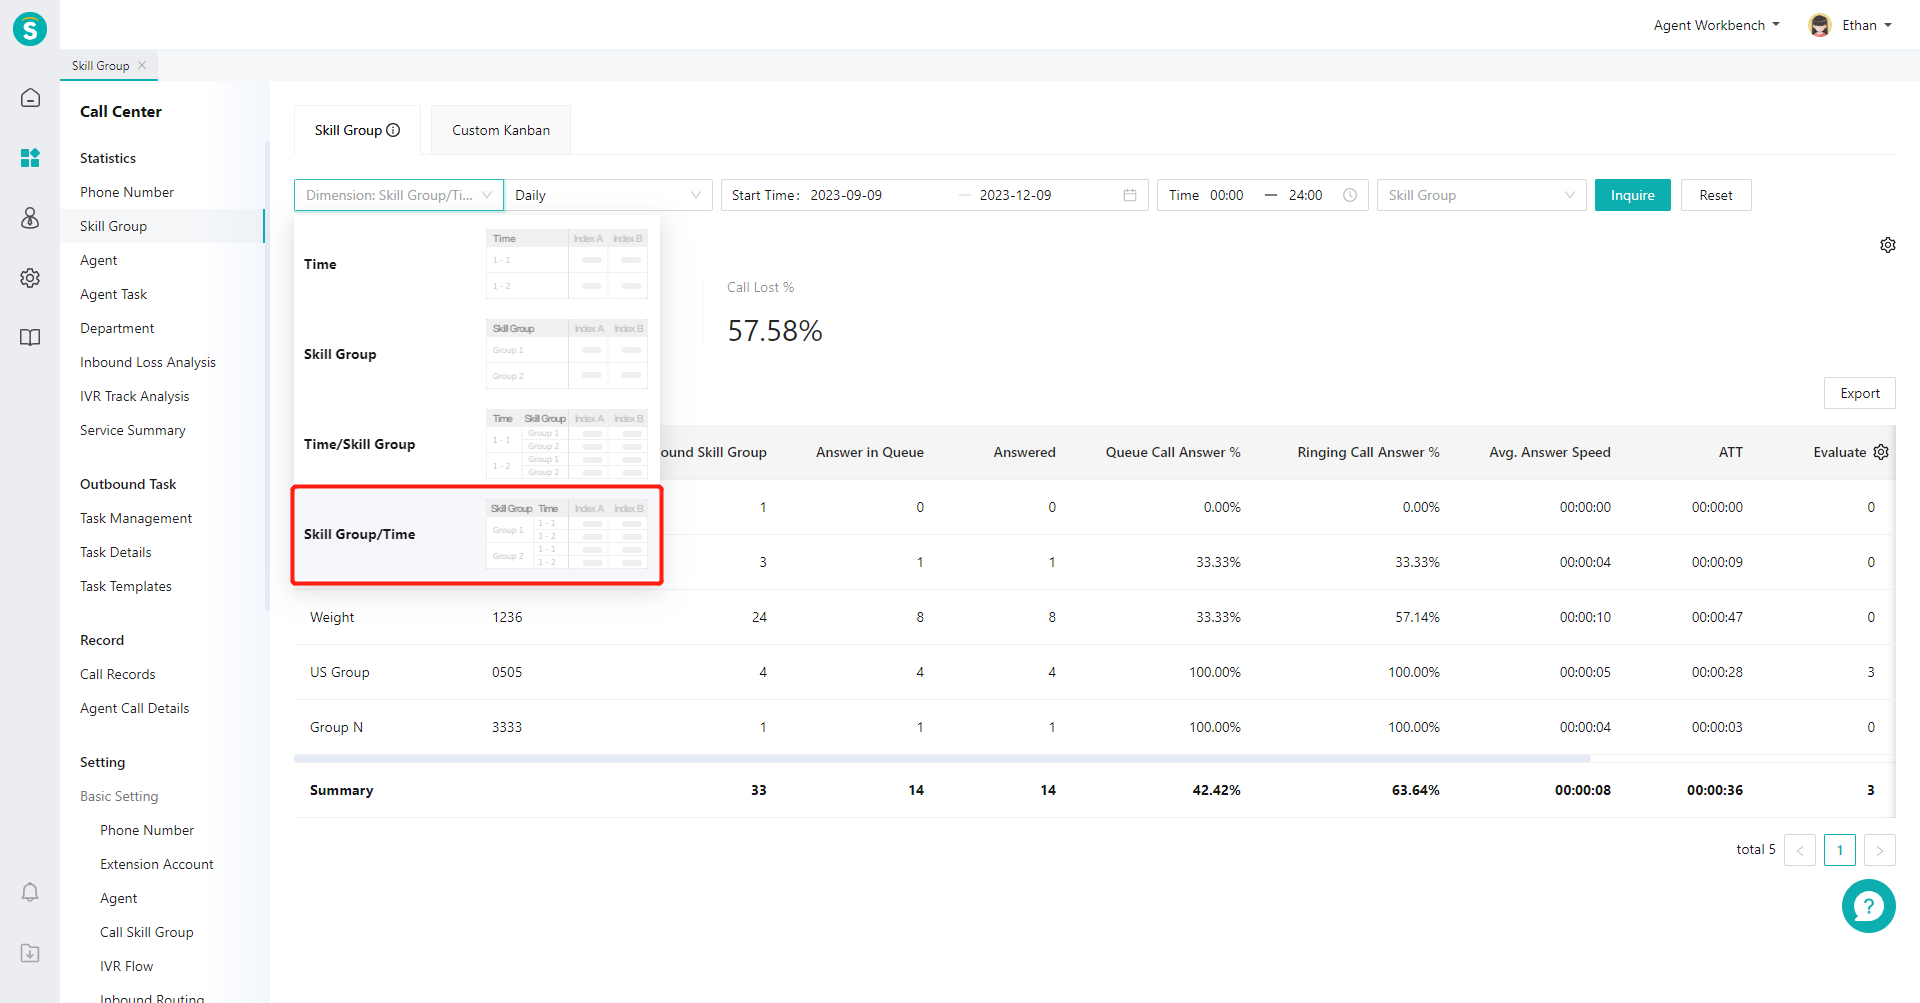
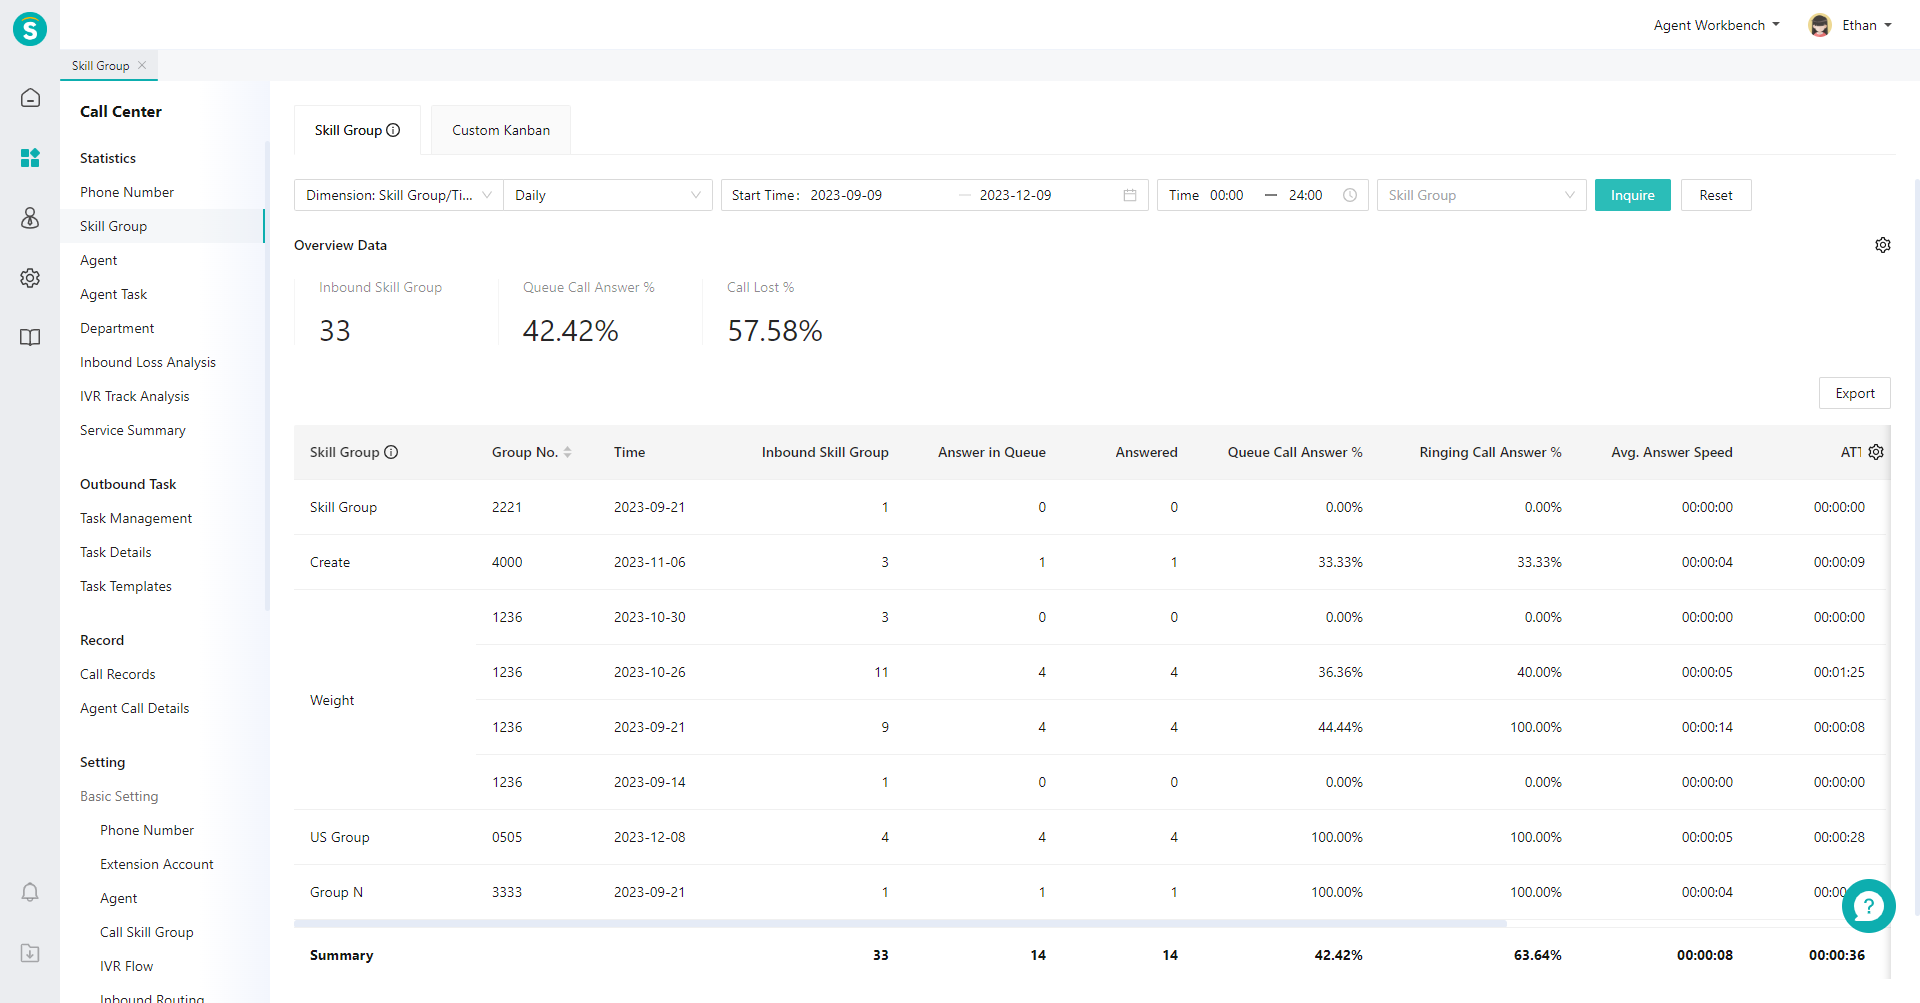
- Summary by skill group + time: In the top filter item, select "Skill Group/Time" for dimension and "Daily Report" for time type, and then click【Query】(Figure 5). View the daily summary data of each skill group in the list (Figure 6).
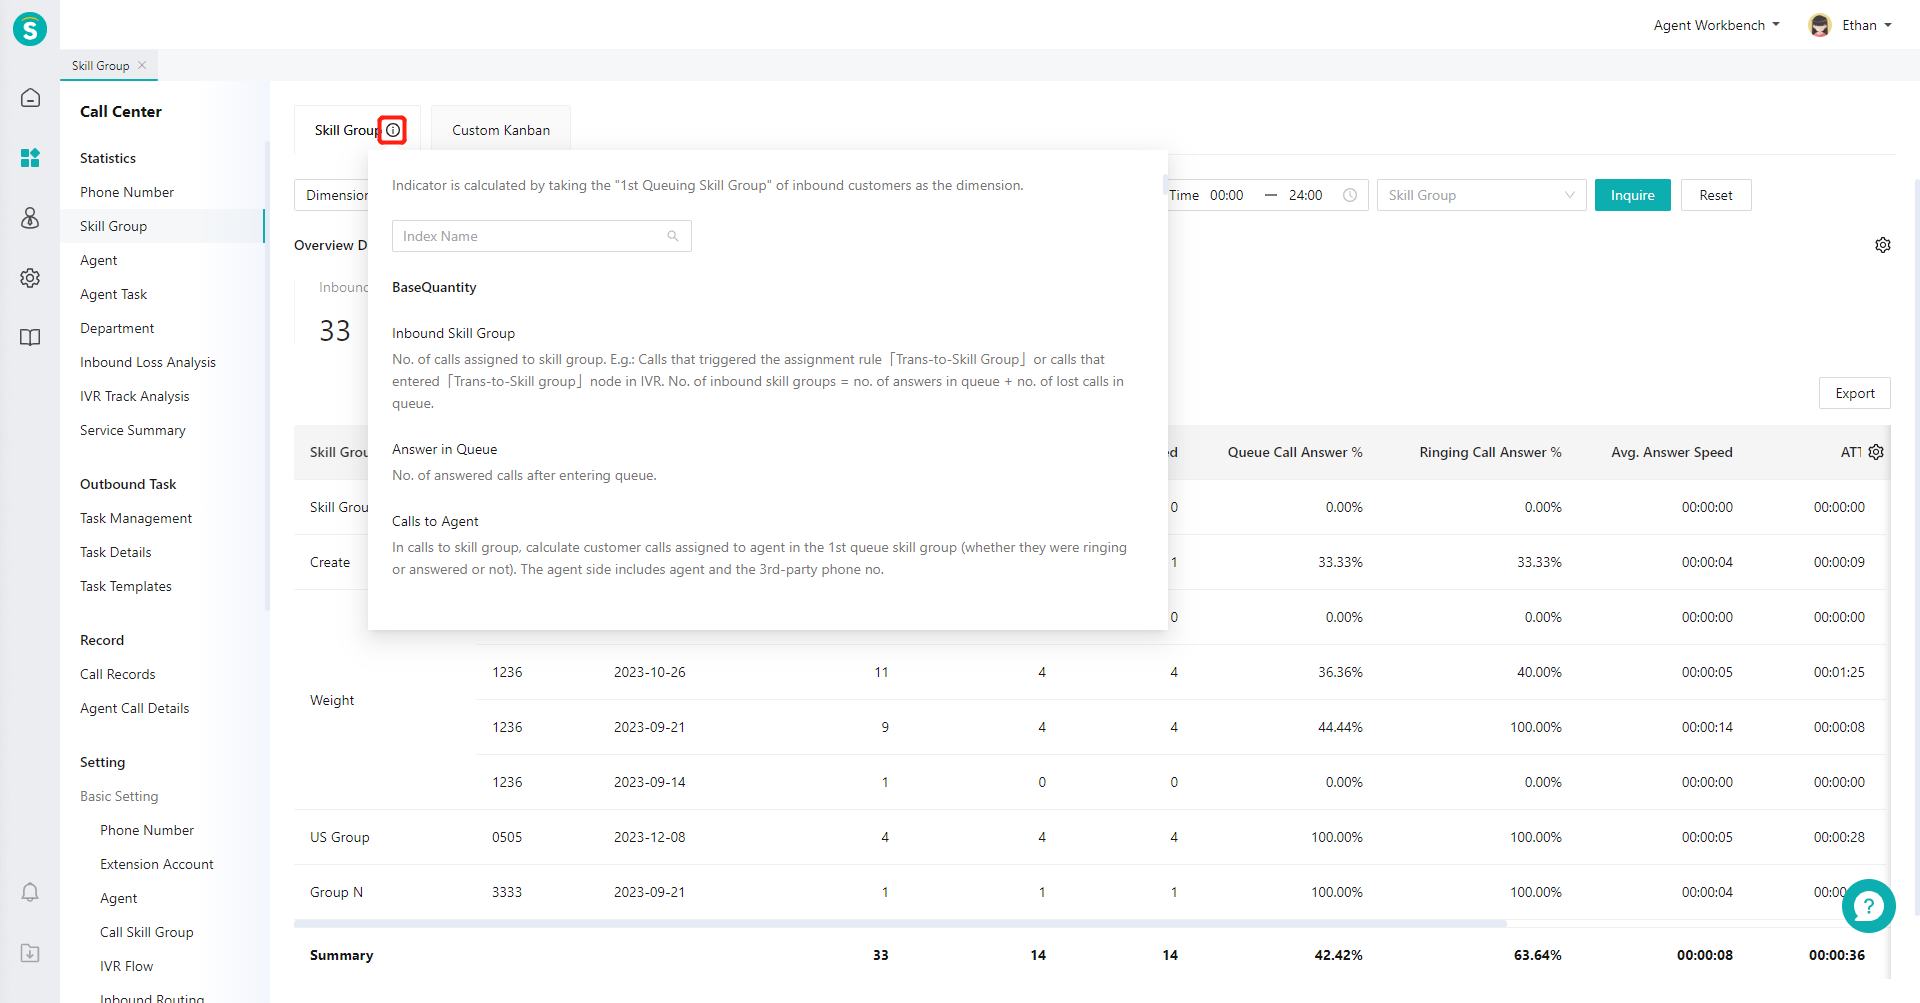
# ● View Indicator Description
Move the mouse to the "Details" icon next to the page title and expand the indicator description bubble (Figure 7).
# ● Create Custom Indicator Scheme
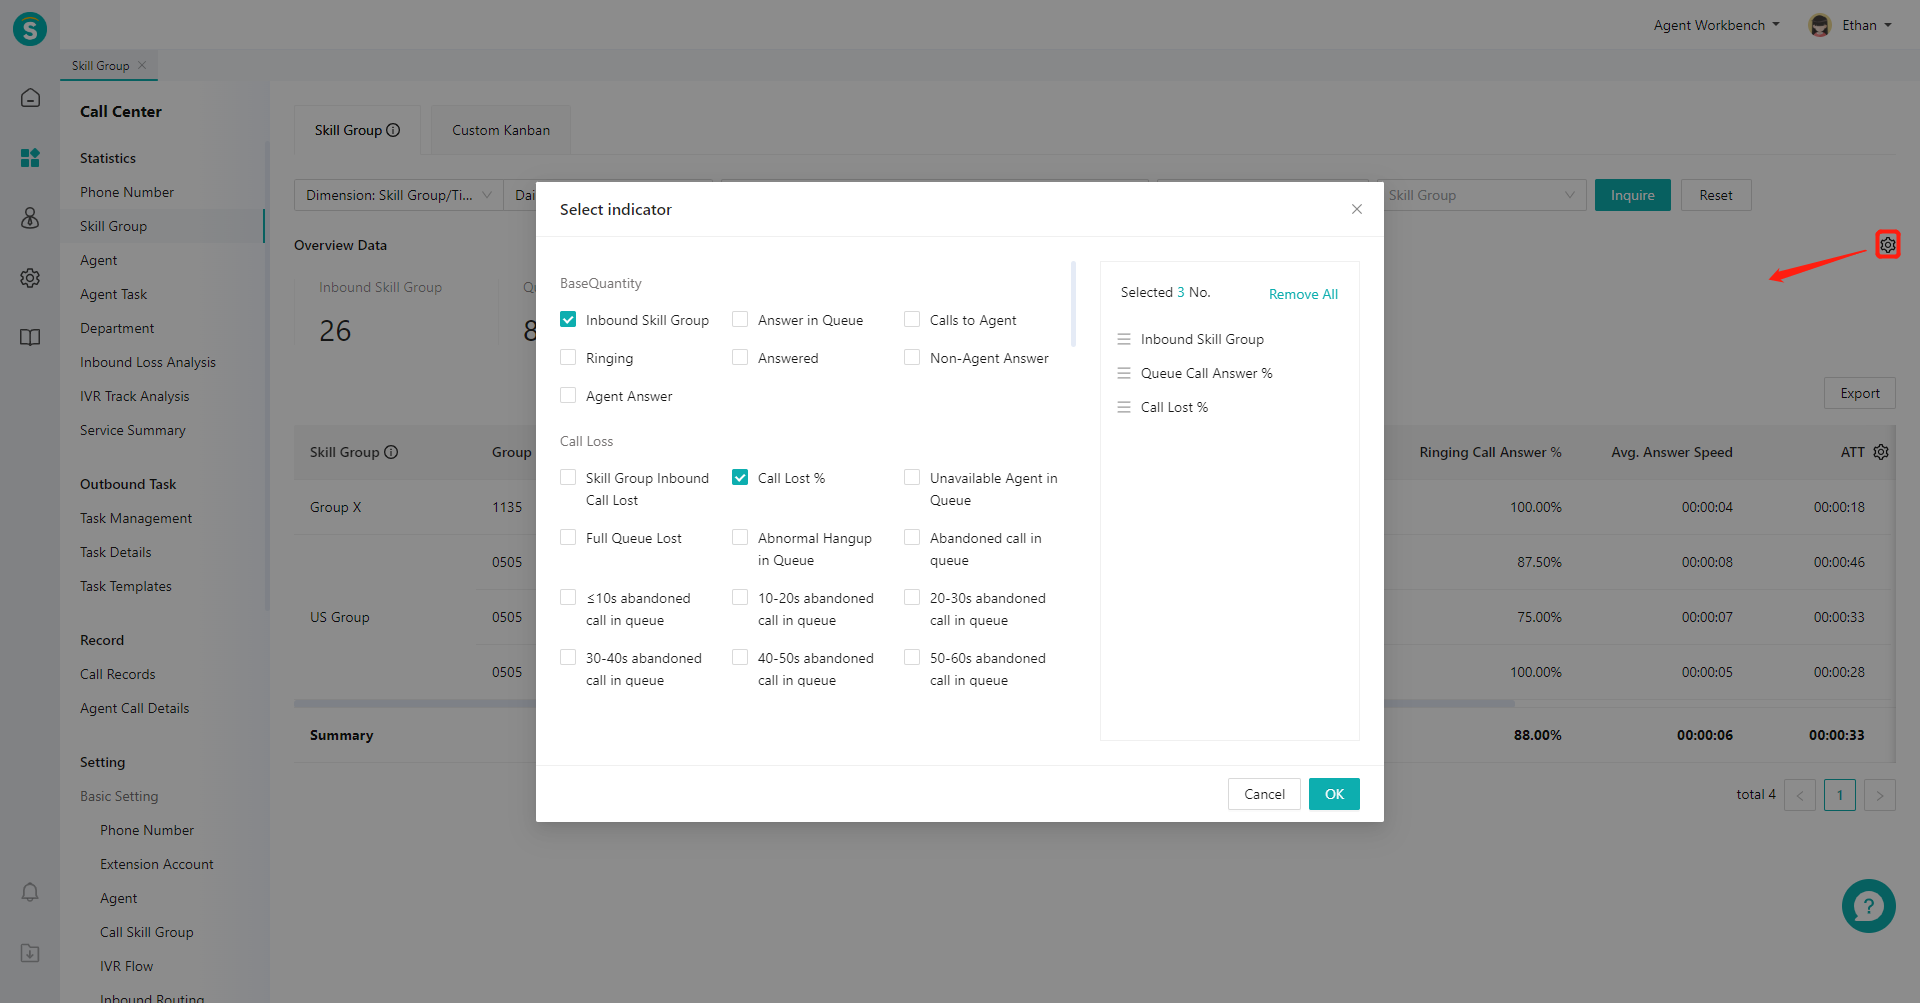
- Click the gear-shaped button on the right side of the overview area to expand the scheme list, select indicators on the left side of the pop-up window, and sort the selected indicators on the right side (Figure 8).
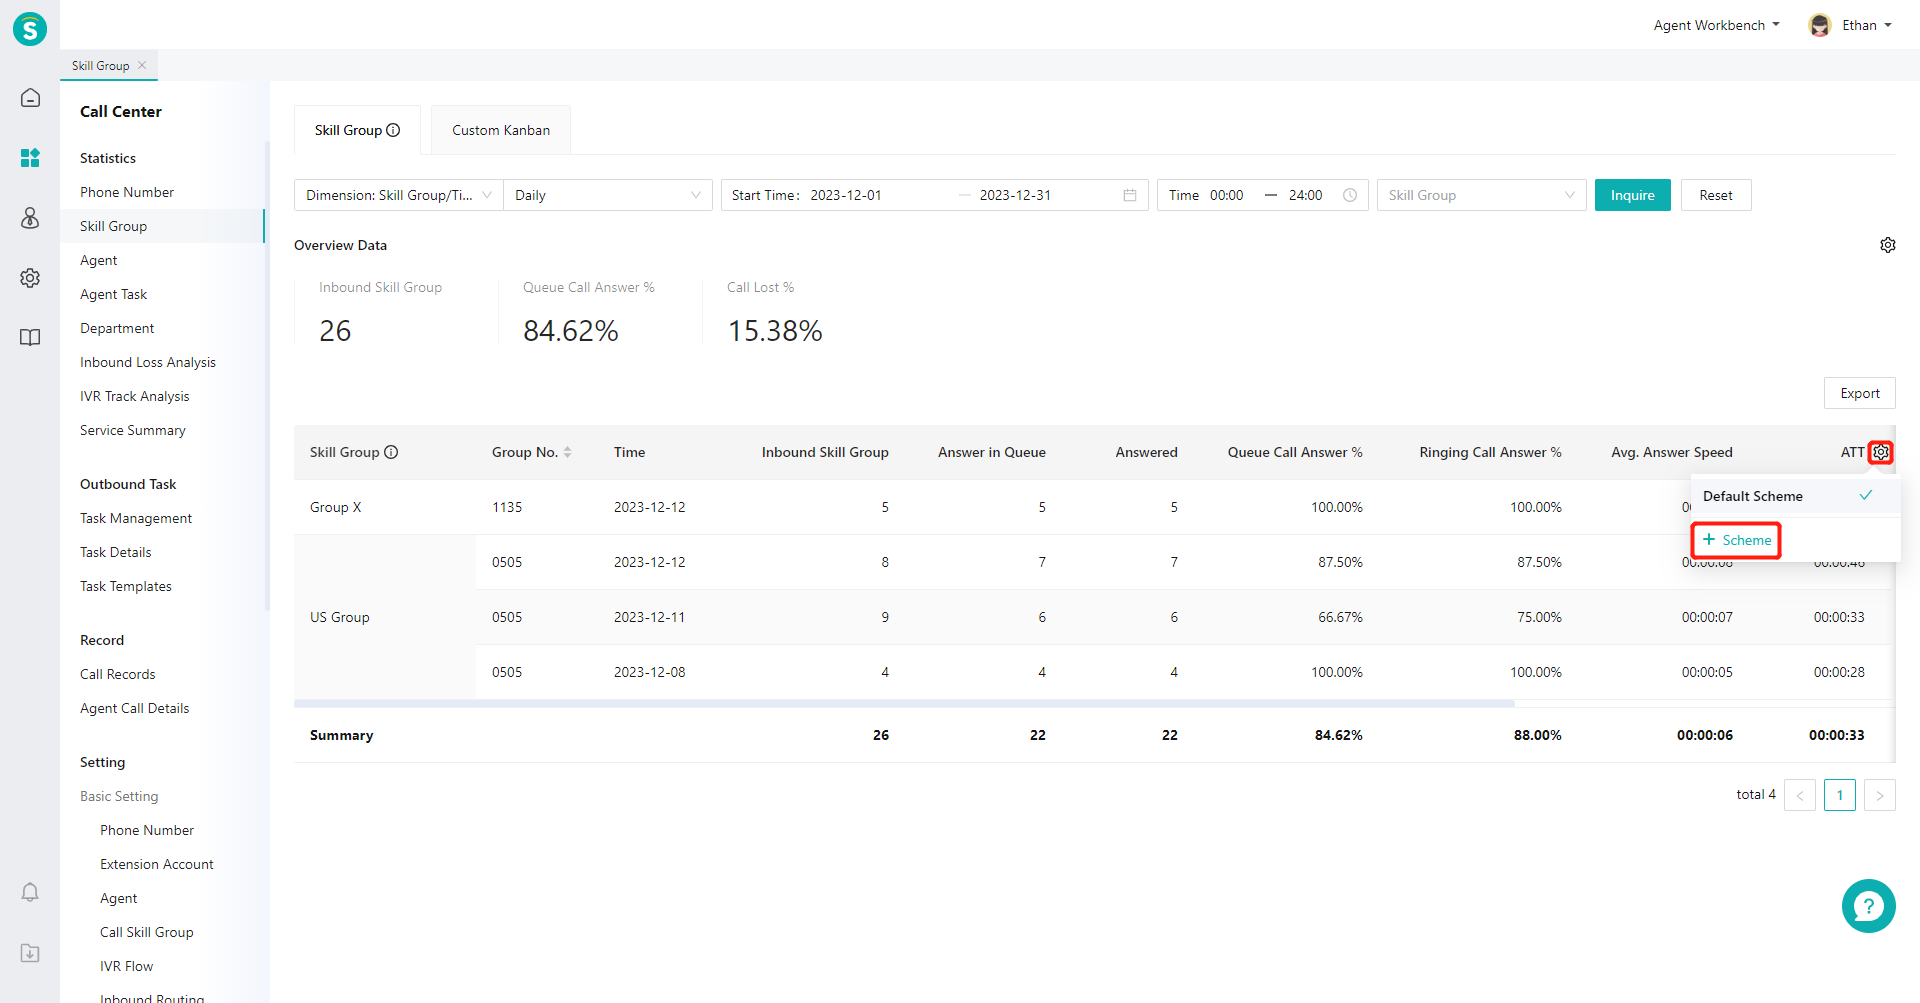
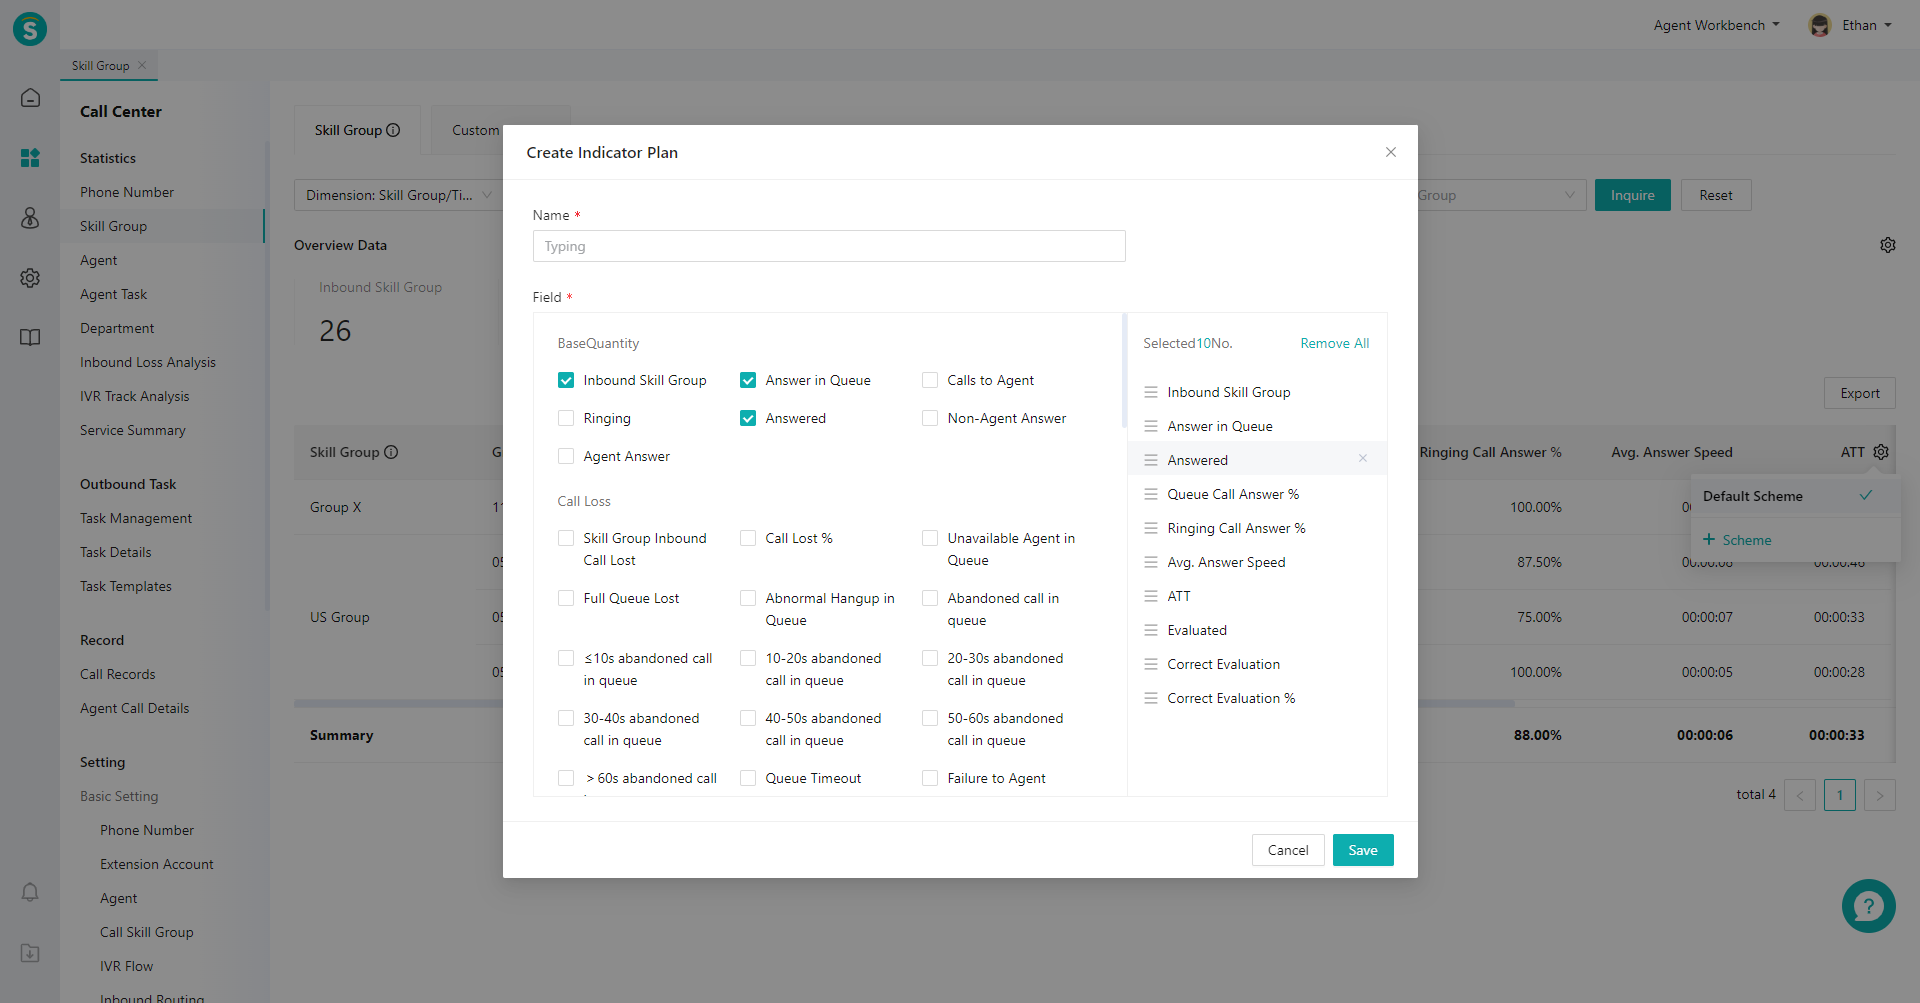
- Click the gear-shaped button on the right side of the list to expand the scheme list, and click【+Scheme】(Figure 9). In the pop-up window, select indicators on the left side and sort the selected indicators on the right side (Figure 10).
Last Updated: 11/18/2024, 7:17:07 PM
- 02
- Real-Time Reception Mode10-25
- 03
- Always On Mode10-25