SLA Statistics Guide
# SLA Statistics Guide
—— Introduction to SLA Statistical Indicators and Calculation Logic
# Guiding Principles for SLA Statistics
All SLA targets are composed of two factors: response and timeout.
Response: Agent has executed the SLA target;
Non-response: Agent has not executed the SLA target;
Timeout: Agent did not achieve the target within the stipulated time;
Not timed out: The stipulated deadline for the target has not been exceeded;
The structure is composed as follows:
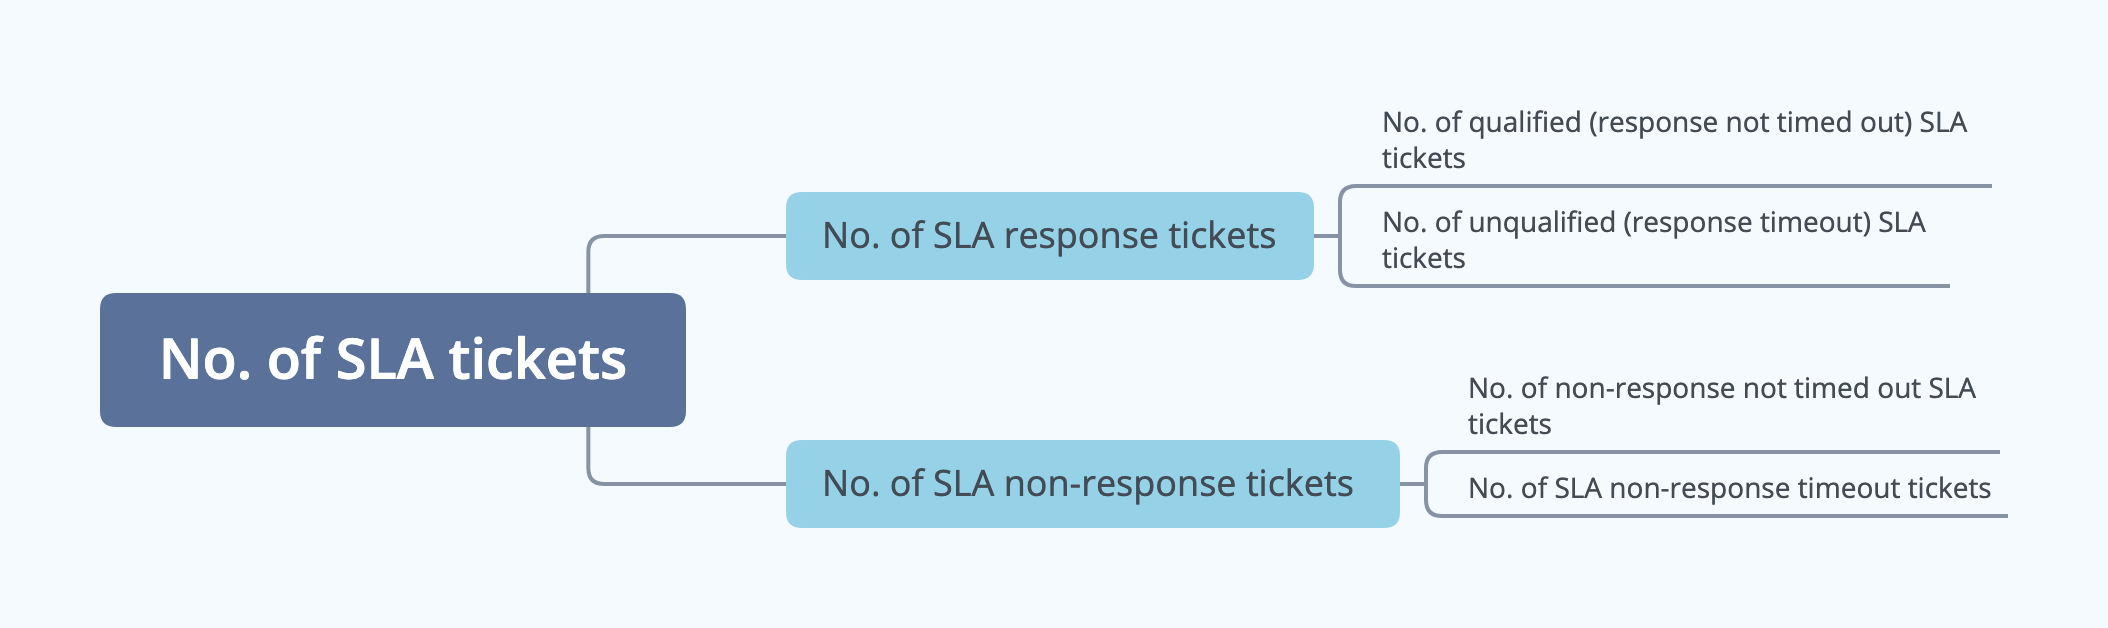
# Definition of SLA Statistical Indicators
Based on the above, there are four dimensions of SLA indicators for tickets: qualified (response not timed out), unqualified (response timeout), non-response not timed out, non-response timeout.
| Indicator | Description |
|---|---|
| No. of SLA tickets | Total number of tickets that have met SLA targets(deduplicated), including normal tickets, tickets processed by bot, deleted tickets, and junk tickets |
| No. of SLA response tickets | Number of tickets where all SLA targets have been responded to (deduplicated) within the query conditions |
| No. of SLA non-response tickets | Number of tickets where at least one SLA target has not been responded to (deduplicated) within the query conditions |
| No. of SLA timeout tickets | Number of tickets where at least one SLA target has timed out (deduplicated) within the query conditions |
| No. of Not Timed Out SLA Tickets | Number of tickets where all SLA targets have not timed out (deduplicated) within the query conditions |
| No. of Qualified (Response Not Timed Out) SLA Tickets | Number of tickets where all SLA targets have been responded to and none have timed out (deduplicated) within the query conditions |
| No. of Unqualified (Response Timeout) SLA Tickets | Number of tickets where all SLA targets have been responded to and at least one target has timed out (deduplicated) within the query conditions |
| No. of Non-response Not Timed Out SLA Tickets | Number of tickets where at least one SLA target has not been responded to and none have timed out (deduplicated) within the query conditions |
| No. of SLA non-response timeout tickets | Number of tickets where at least one SLA target has not been responded to and at least one target has timed out (deduplicated) within the query conditions |
| SLA Qualification (Response Not Timed Out) % | No. of SLA Qualification (Response Not Timed Out) Tickets / No. of SLA Responded Tickets X 100% within the query conditions |
For SLA non-response tickets, from a product design perspective, whether timed out or not is just a transient state, as the next moment it may change from not timed out to timed out with the changing attributes of the ticket; from a business process perspective, when evaluating the processing time after the business has concluded, if there are still non-response tickets, it definitely indicates a serious problem in ticket assignment or agent execution.
Therefore, when calculating the qualification rate, non-response tickets are not counted.
# Structure of SLA Statistics
The statistical report is designed with a "Total-Sub-Total" structure, aiming to allow you to see the SLA situation more intuitively and clearly, and to make it easier to identify problems.
By using the overview data and SLA qualification trend charts, you can easily assess whether the current "qualification rate" is normal.
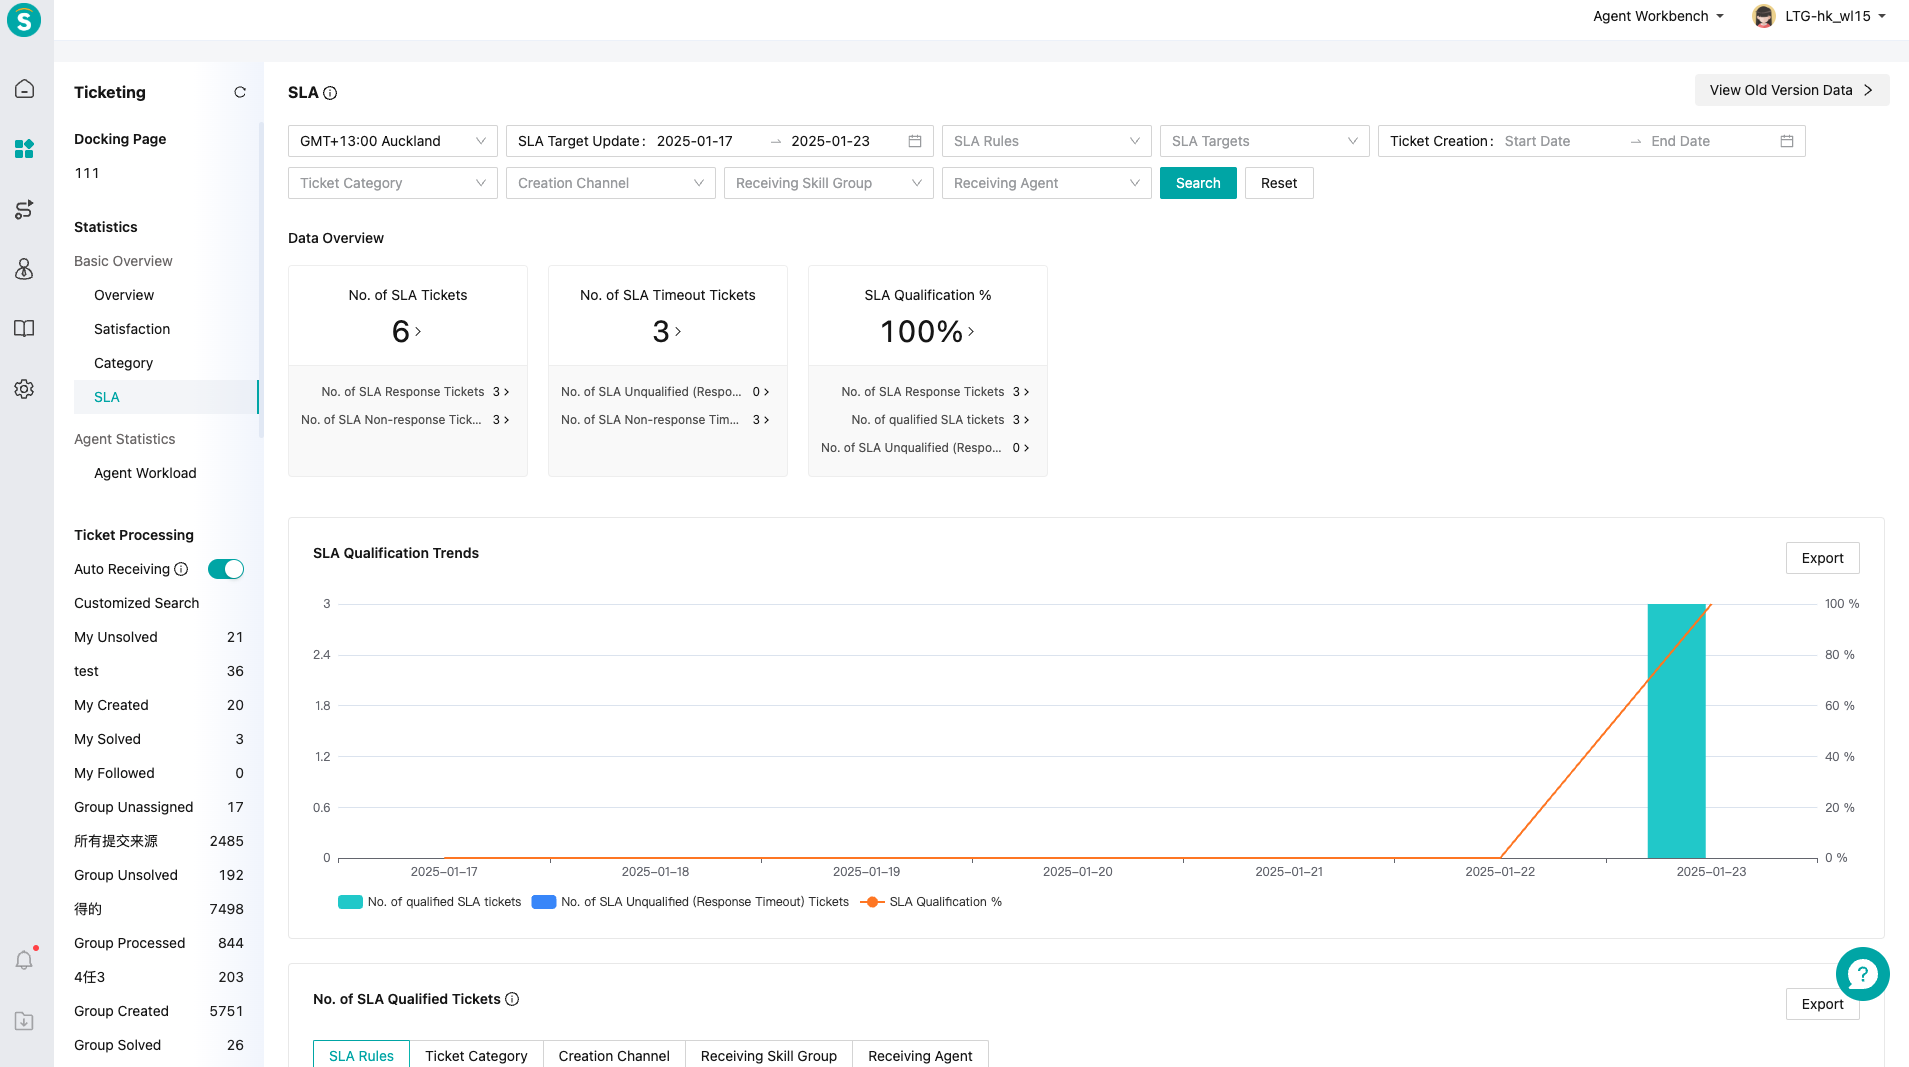
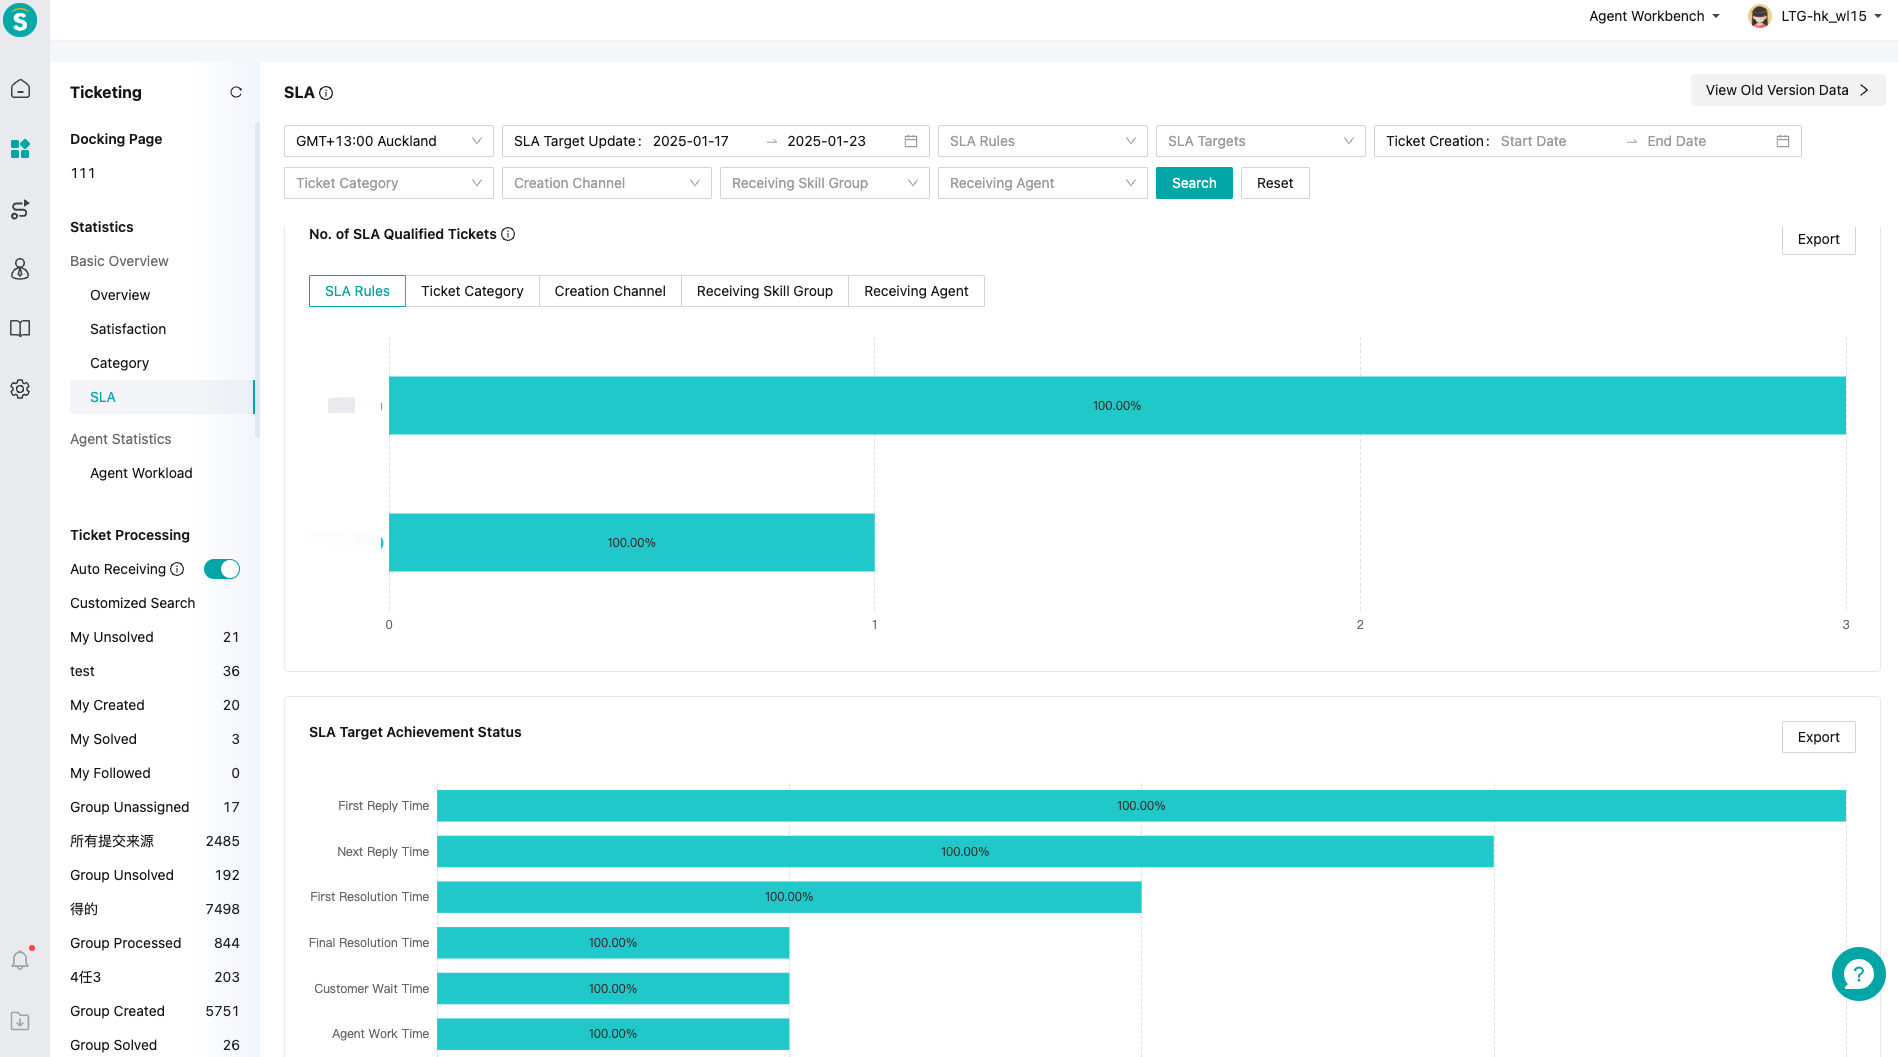
If problems are found, you can check the SLA qualification status from various dimensions such as source, category, skill group, and different SLA targets to identify where the problem occurs.
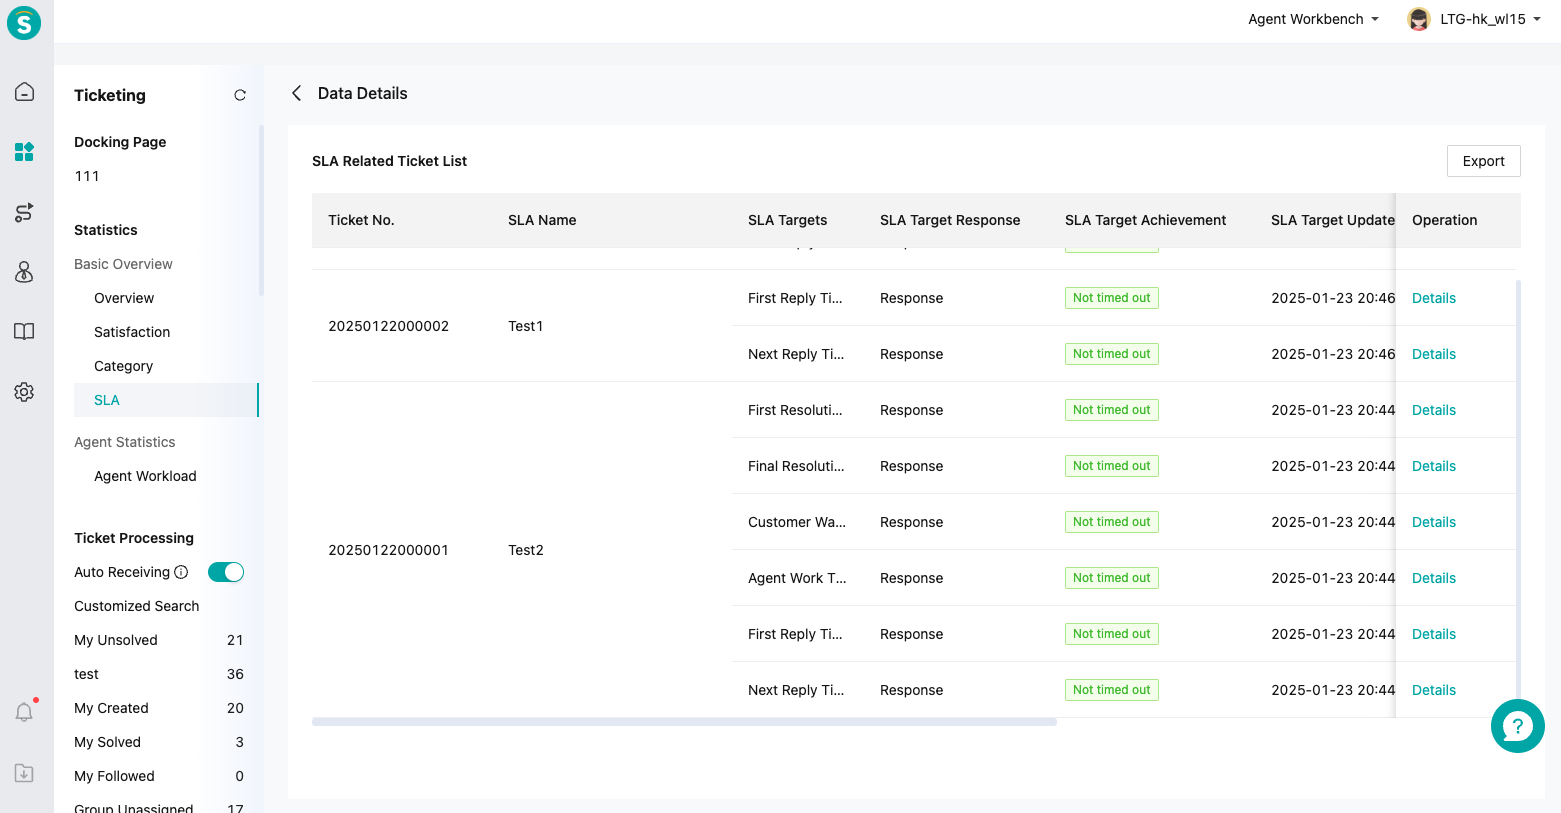
It is important to note that the chart is limited by location and space and will only display the "Top 30 Responded Tickets". If you wish to see all the data, you can view it through the detailed data at the bottom of the report.
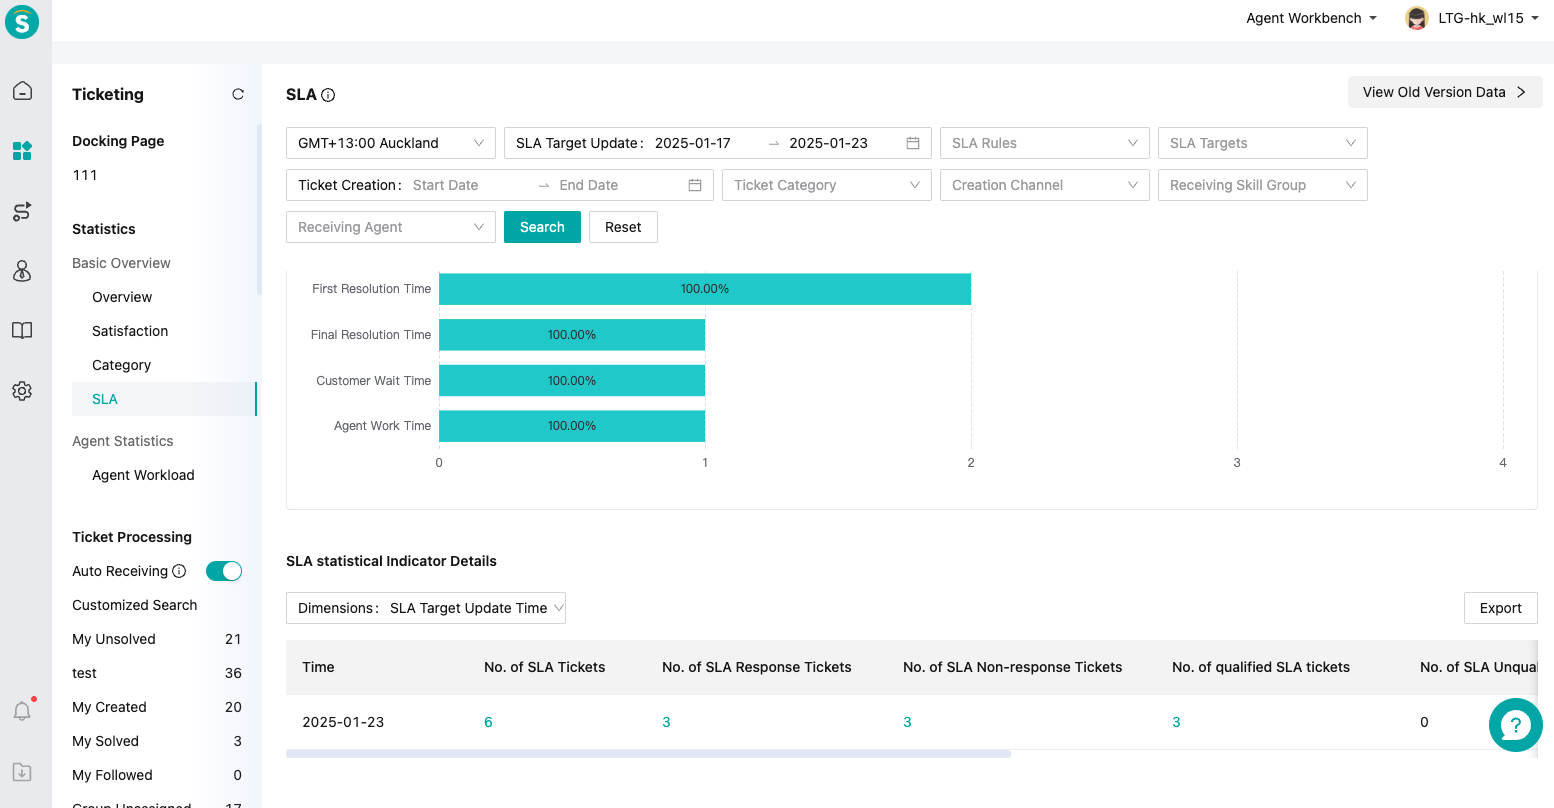
Click any number in the detailed data to view all SLA targets for the ticket within the query conditions. It should be noted that the ticket category, assigned agent, and other fields you see here reflect the values at the moment the SLA targets were updated, not the latest values of the current ticket.